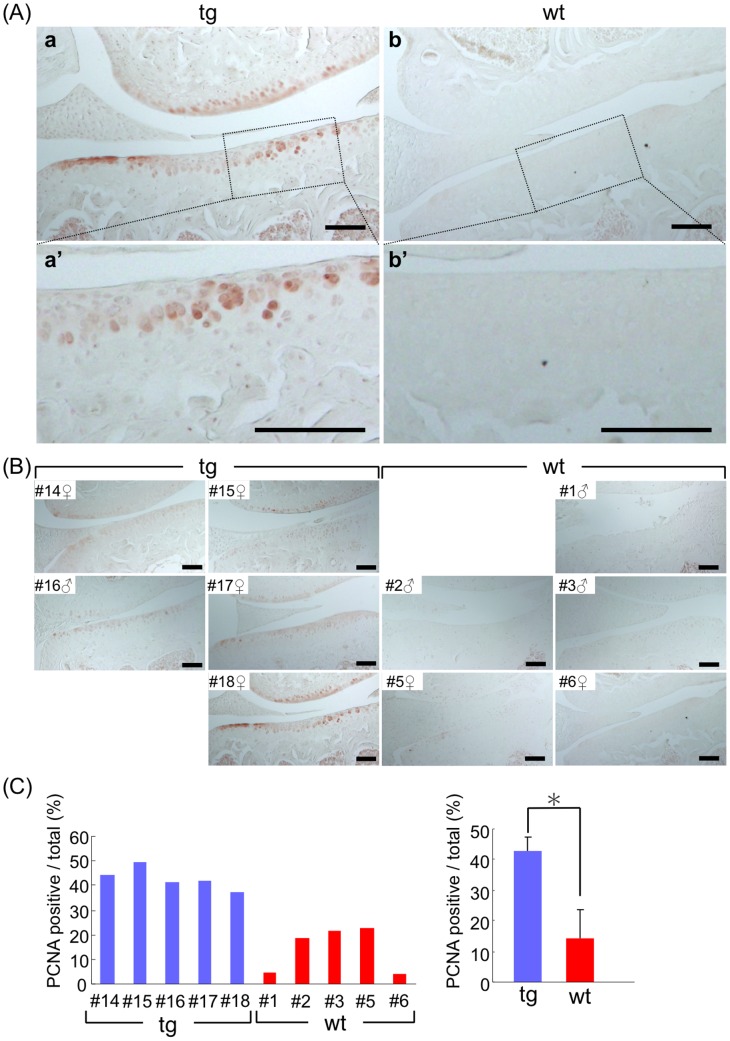
Figure 6. Sustaining proliferation of articular chondrocytes in aged mice by CCN2 overexpression.
(A) PCNA staining in chondrocytes of knee joint cartilage (tibial plateau, frontal sections) of TG joints from 21-month-old mice (a) and of WT joints (b) from 18-month-old mice. a’ and b’: higher magnification of the medial tibial plateau in the load-bearing region indicated by the dotted box in a and b. Bars: 100 µm. In TG articular cartilage, PCNA-positive chondrocytes were observed in the surface area. Bars: 100 µm. (B) PCNA staining of knee joints from 21-month-old littermates and 18-month-old littermates. (C) Left: Percentage of PCNA-positive cells per total cells in TG or WT tibia medial cartilage of individual mice. Right: mean value for TG and WT. TG cartilage showed a significantly higher ratio of PCNA-positive chondrocytes than WT cartilage. *: p<0.001.

