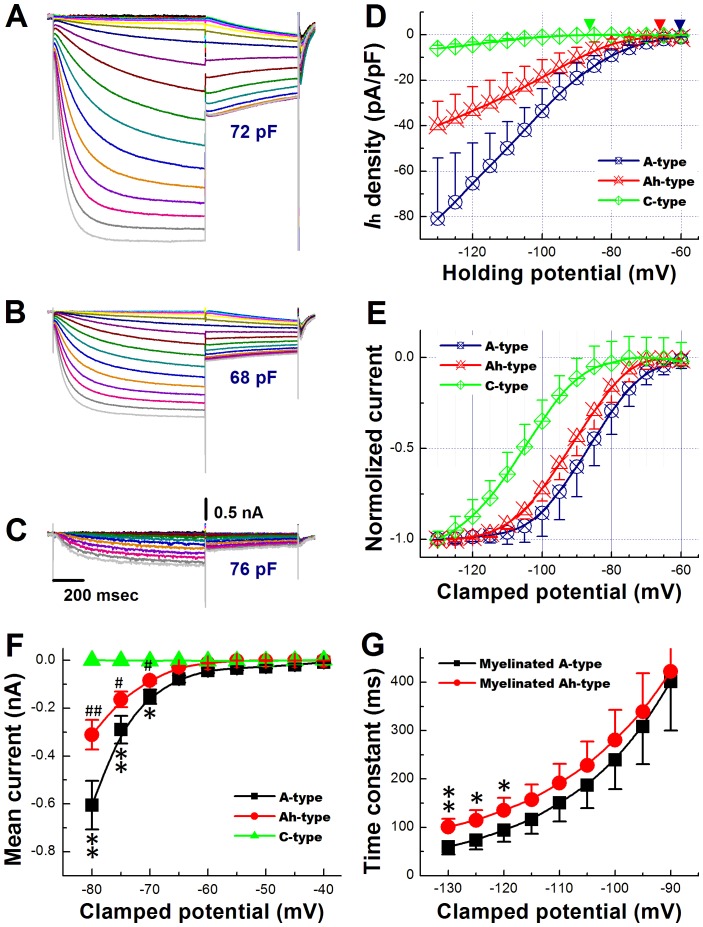
Figure 6. Characterization of Ih in VGNs from adult, non-ovariectomized rats.
A), B), and C) Hyperpolarization-evoked currents recorded from an A−, Ah− and C-type neuron (panel A, B and C, respectively). Cells were subjected to a twin-pulse protocol, wherein they were held between −40 and −130 mV in steps of 5 mV for 1 second, and then clamped to −80 mV for 600 ms before return to the holding potential of −40 mV. The interval between each twin-pulse was 1 s. In the A− and Ah-type neuron, step hyperpolarizations evoked inward currents that had an instantaneous component followed by a slowly activating component, whereas the initial instantaneous component was not observed in the C-type neuron. The magnitude of hyperpolarization-evoked currents was largest in the A-type cell, intermediate in the Ah-type cell, and smallest in the C-type cell. Clamping the cell to −80 mV caused slowly activating or slowly deactivating tail currents, depending on the voltage of the preceding clamp step. D), Plots of hyperpolarization-evoked current densities as a function of voltage for all three neuronal subtypes. Endpulse currents were used for analyses. Data are mean ±1 SD. E) Activation curves obtained from tail current recordings as shown in (A), (B) and (C). Sigmoid fittings indicated half maximal activation at −88.0±3.14 mV, −92.4±4.5 mV, and −106±12.8 mV (P<0.01 by ANOVA) in A-, Ah−, and C-type cells, respectively (denoted by the downward arrows). Slopes of the activation curves were S1/2 = 6.14±1.22 mV, 6.13±0.98 mV, and 7.14±2.2 mV, P>0.05 by ANOVA ). F), Plots of inward current densities elicited during hyperpolarizations to potentials ranging from −40 to −80 mV. Scale bars in (C) also apply for (A) and (B). Data are mean ±1 SD, *P<0.05 and **P<0.01 vs Ah-type, # P<0.05 and ## P<0.01 vs C-type. G) Time constants of Ih activation as a function of voltage in A and Ah type neurons. Time constants were obtained by monoexponential fit of the current traces in (A) and (B). Values are mean ± SD. *P<0.05 and **P<0.01 vs A-type.

