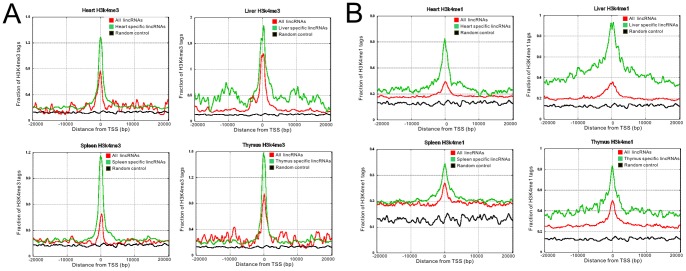
Figure 4. Histone marks of tissue specific lincRNAs.
(A) Trimethylation of lysine 4 of histoneH3 (H3K4me3) at promoter regions for heart, liver, spleen and thymus tissue. (B) Methylation of lysine 4 of histoneH3 (H3K4me1) at promoter regions. Red lines represent all lincRNAs, green lines represent tissue-specific lincRNAs and black lines represent random control.

