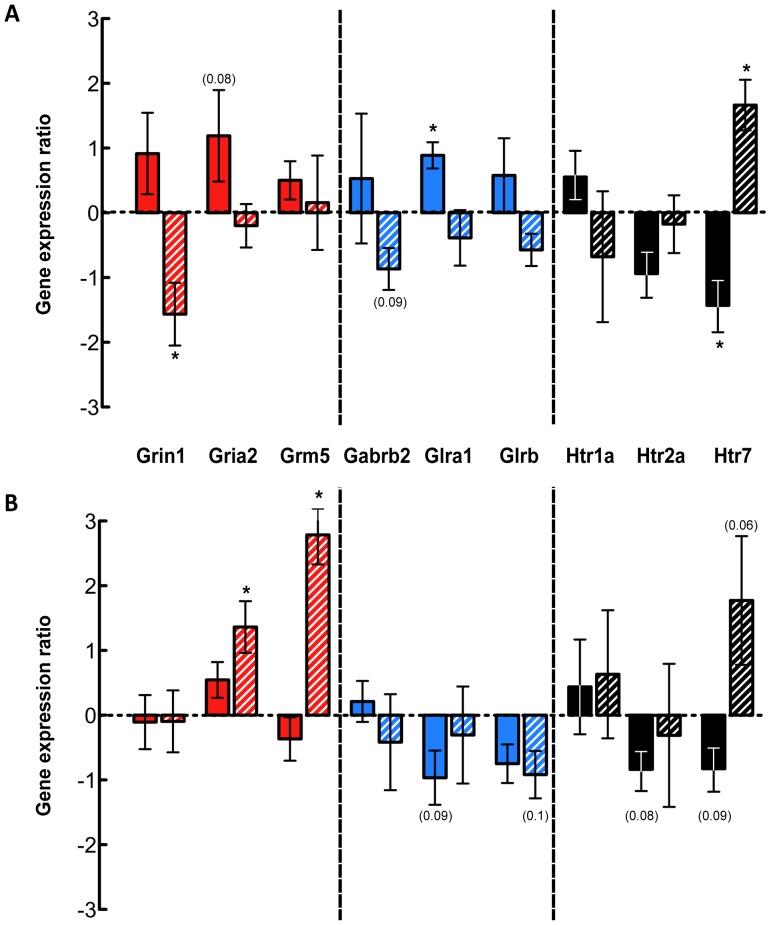
Figure 5. Gene expression quantitation by qRT-PCR for L1–2 and L3–5 spinal segments.
Gene expression changes in the spinal cords of P7- (solid bars) and P28-injured (hatched bars) opossums are shown relative to control expression. A: Gene expression ratios for the L1–2 spinal segments. B: Gene expression ratios for the L3–5 spinal segments. All data are mean ± sem. *P≤0.05; P values ≤0.1 are indicated in parentheses.

