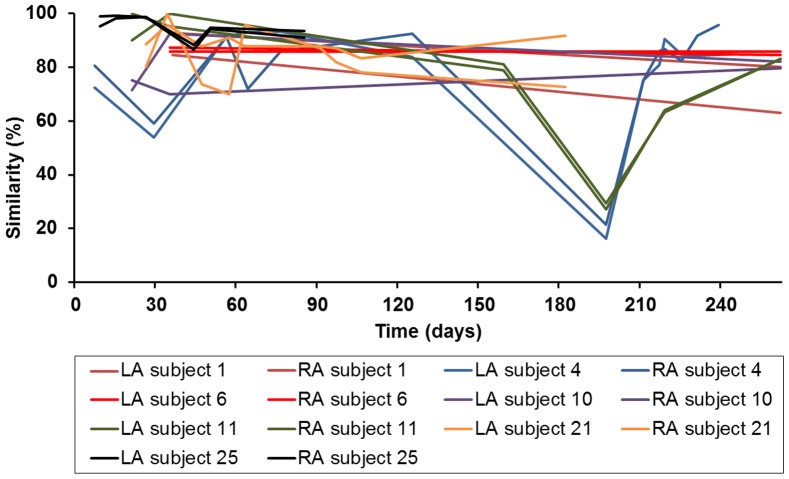
Figure 2. Dynamics (moving window analysis) of 7 subjects of the DGGE results.
LA = left axilla; RA = right axilla. Left axis indicates the similarity (based on Pearson correlation) of the axillary sample compared to the previous axillary sample. The higher the curve, the more similar the samples. The axillary microbiome was relatively constant throughout time, even on a longer timescale (9 months). Two followed-up subjects experienced an community shift from one cluster to the other, after which the microbiome again was stable (subject 4 and 11).

