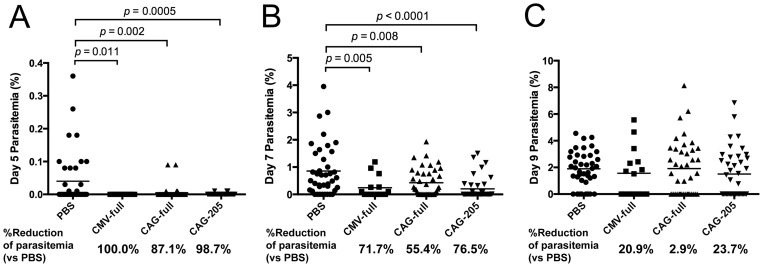
Figure 5. Parasitemia in the immunized mice after parasite challenge.
Giemsa-stained thin smears of tail blood were prepared at days 5, 7 and 9 after challenge. The percentage parasitemias and parasitemia reduction rates in the individual mice were compared with those from the PBS-control mice using the following formula: % reduction = [1–(% parasitemia of immune group)/(% parasitemia of PBS group]). Data from 3 independent experiments were pooled (n = 40), except for the CMV-full group (n = 15).

