
FIG. 2.
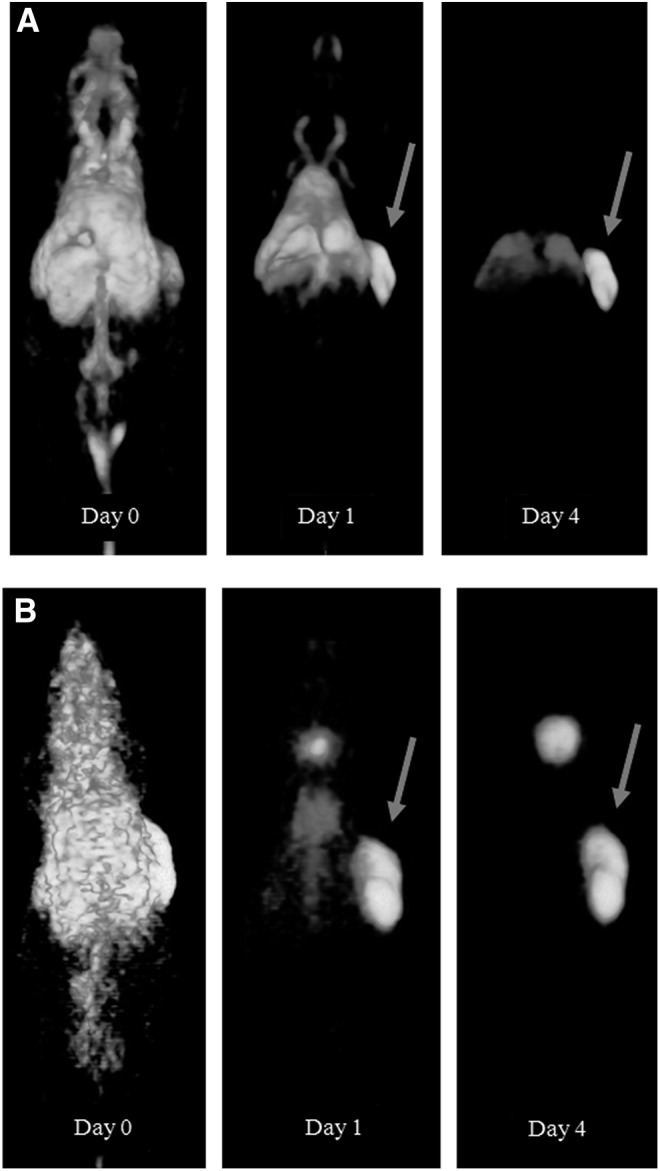
Three dimensional (3D) reconstructed PET images of representative mice with a s.c. NU-12 tumor on the right flank 0, 1, and 4 days after injection and fused PET/CT images after 7 days of 3 μg 89Zr-Df-cG250 (A) or 3 μg 124I-cG250 (B). Note the clear visualization of the s.c. tumor (arrows) from day 1 p.i. onwards with both radiolabeled mAbs.