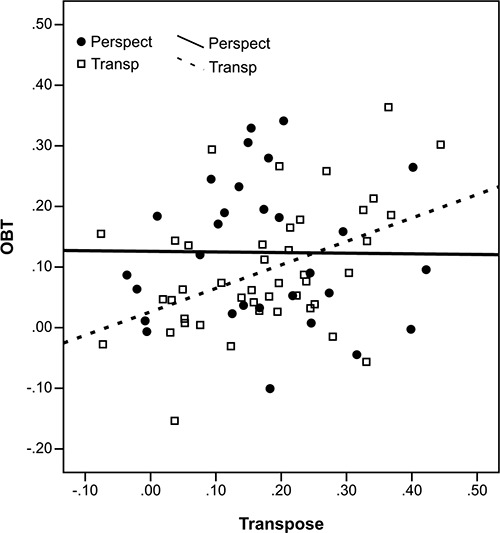
Figure 3.

Scatterplot of the association between the Composite RTs relating to the Transpose and OBT tasks. Lines depict linear fit for subsamples defined by strategy reported (perspect = perspective transformers; transp = spatial transposers)

Scatterplot of the association between the Composite RTs relating to the Transpose and OBT tasks. Lines depict linear fit for subsamples defined by strategy reported (perspect = perspective transformers; transp = spatial transposers)