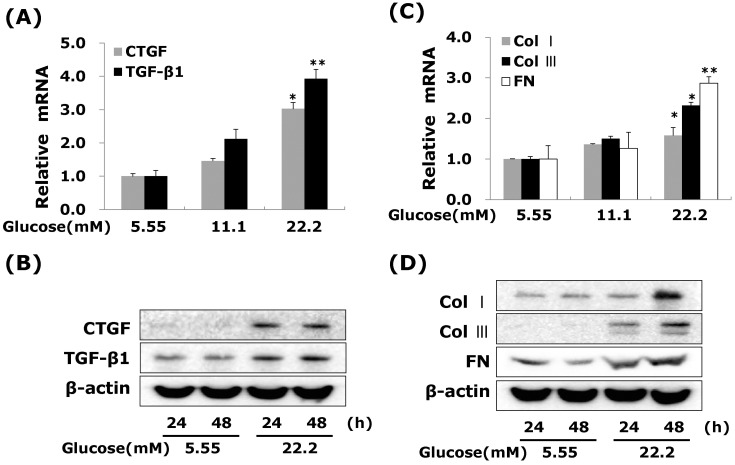
Fig. 2.
High glucose increases CTGF, TGFβ1, and ECM components mRNA and protein expressions in VSMCs. Cells were treated with glucose concentration (5.55, 11.1 and 22.2 mM) for 24hrs or 48 hrs. After 24 hrs, CTGF, TGF-β1 (A) and ECM components mRNA (C) were measured by real-time PCR. After 24 or 48 hrs, CTGF, TGF-β1 (B) and ECM components protein expression (D) were detected by western blot. Results are represented as the mean±S.E.M (n=4). *p<0.05 compared with 5.55 mM glucose, **p<0.001 compared with 5.55 mM glucose.

