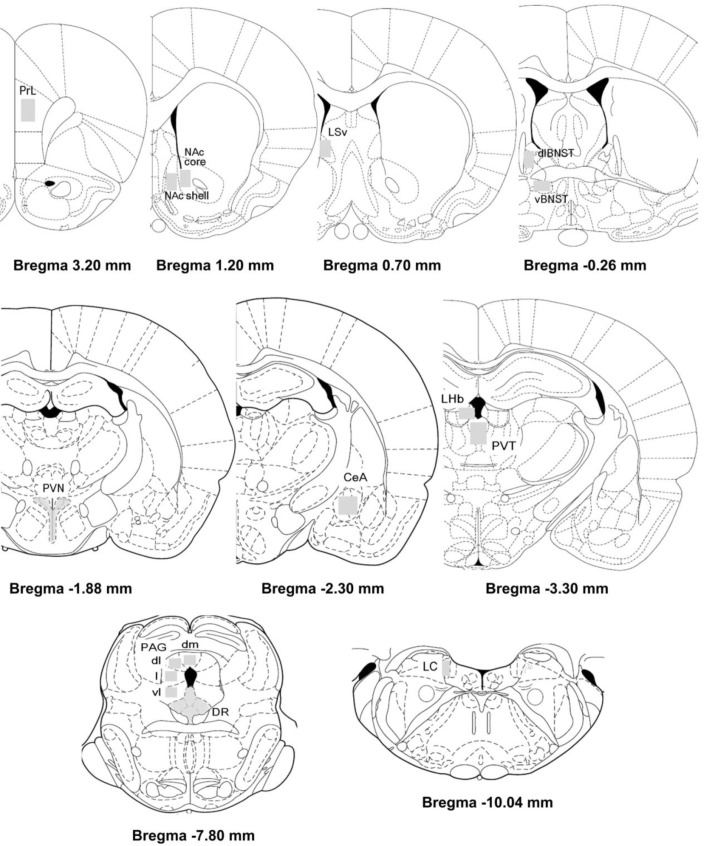
Fig. 2.
Schematic diagrams adapted from the Paxinos and Watson atlas showing selected brain areas in which c-Fos-like immunoreactive cells were counted. PrL, prelimbic cortex (3.20~2.70 mm from bregma, 25×104 µm2); NAc core, nucleus accumbens core (1.70~1.00 mm from bregma, 10×104 µm2); NAc shell, nucleus accumbens shell (1.70~1.00 mm from bregma, 10×104 µm2); LSv, ventral lateral septal nucleus (1.00~0.70 mm from bregma, 10×104 µm2); dlBNST, dorsolateral bed nucleus of the stria terminalis (-0.26~-0.30 mm from bregma, 4×104 µm2); vBNST, ventral bed nucleus of the stria terminalis (-0.26~-0.30 mm from bregma, 12.5×104 µm2); PVN, hypothalamic paraventricular nucleus (-1.80~-1.88 mm from bregma); CeA, central nucleus of the amygdala (-1.88~-2.80 mm from bregma, 6×104 µm2); PVT, paraventricular thalamic nucleus (-3.30~-4.16 mm from bregma); LHb, lateral habenula (-3.30~-4.16 mm from bregma); PAG [periaqueductal gray (dm, dorsomedial; dl, dorsolateral; l, lateral; vl, ventrolateral)] (-6.30~-8.00 mm from bregma, 1×104 µm2); DR, dorsal raphe (-7.30~-8.00 mm from bregma); LC, locus ceruleus (-9.68~-10.04 mm from bregma).

