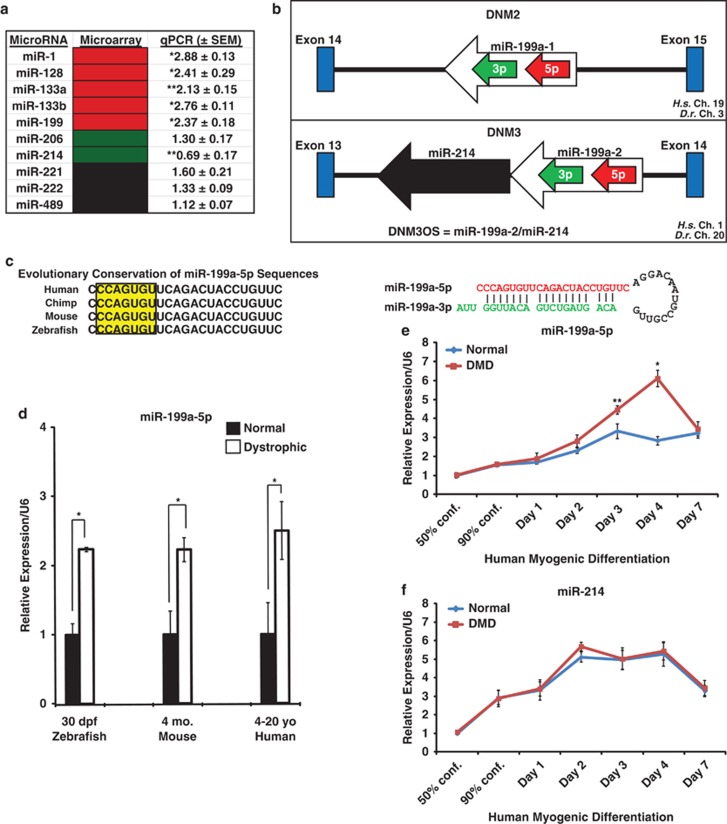
Figure 1.
MiRNAs that are dysregulated in dystrophin-deficient skeletal muscle. (a) Table of dysregulated miRNAs in normal and dystrophic zebrafish at 30 dpf. Induced in expression miRNAs are shown in red, while reduced in expression miRNAs are shown in green. Unchanged or not significantly expressed miRNAs are shown in black. Comparisons in miRNA expression level changes by real-time qPCR are listed between sapje and unaffected zebrafish. Real-time qPCR values were normalized to U6 small nuclear RNA (snRNA) levels, and all experiments were performed in triplicate. (b) Genomic location of the miR-199a-5p transcript that is transcribed in both directions within introns of the dynamin-2 and dynamin-3 genes. Although both miR-199a-1 and miR-199a-2 genomic sequences can result in the formation of mature miR-199a-5p transcript, only miR-199a-2 is transcriptionally linked to miR-214 via its proximity in the genome. Chromosomal locations of the human (H.s.=Homo sapiens) and zebrafish (D.r.=Danio rerio) miR-199a-5p (red arrow) and miR-199a-3p (green arrow) mature miRNA sequences are shown. (c) The left panel shows evolutionary conservation of the human, chimp, mouse, and zebrafish miR-199a-5p mature miRNA sequences in the 5′ to 3′ orientation. Inset box with yellow highlighted area denotes conserved seven-nucleotide seed sequence of the miR-199a-5p mature miRNA. The right panel shows the miRNA stem loop formation of the miR-199a-5p (red lettering) and the miR-199a-3p (green lettering) structure with base-pairings. (d) Real-time qPCR of miR-199a-5p levels in normal and dystrophic muscles isolated from zebrafish (whole fish), mouse, and human biopsies. Normal versus DMD human muscle biopsies, wild-type versus mdx5cv (TA muscles; adult 3–6–month-old males), and unaffected versus sapje (5 dpf, n=10 fish). Real-time qPCR values were normalized to U6 snRNA levels, and all experiments were performed in triplicate. (e) Real-time qPCR of miR-199a-5p expression levels in normal and DMD cell lines during myogenic differentiation of MB into MT. (f) Real-time qPCR of miR-214 expression levels in normal human and DMD myogenic cell lines during myogenic differentiation. Expression normalized to 50% confluent MB and to U6 snRNA loading control. *P-value<0.005; **P-value<0.05. All samples analyzed in triplicate in three separate normal or DMD cell lines. ND, not determined

