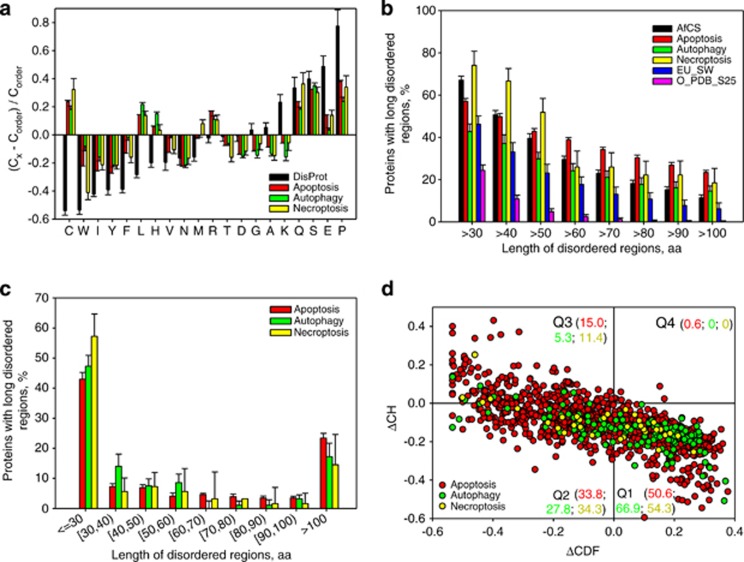
Figure 2.
Peculiarities of intrinsic disorder distribution in human PCD proteins. (a) Fractional difference in the amino-acid composition between the different PCD-related proteins (apoptosis, red bars; autophagy, green bars; and necroptosis, yellow bars) and a set of ordered/structured proteins calculated for each amino-acid residue (compositional profiles). The fractional difference was evaluated as (Cx−Corder)/Corder, where Cx is the content of a given amino acid in a query set, and Corder is the corresponding content in the data set of fully ordered proteins. Composition profile of typical IDPs from the DisProt database is shown for comparison (black bars). Positive bars correspond to residues found more abundantly in PCD-related proteins, whereas negative bars show residues, in which PCD-related proteins are depleted. Amino-acid types are ranked according to their increasing disorder-promoting potential.31 (b) Abundance of predicted long disordered regions in human PCD proteins (apoptosis, red bars; autophagy, green bars; and necroptosis, yellow bars) in comparison with long disordered regions in 2329 proteins involved in cellular signaling (AfCS, black bars), 53 630 eukaryotic proteins from SWISS-PROT (EU_SW, blue bars), and 1138 sequences corresponding to ordered parts of proteins from PDB Select 25 (O_PDB_S25, pink bars). (c) Distribution of the length of the disordered segments in human PCD-related proteins (apoptosis, red bars; autophagy, green bars; and necroptosis, yellow bars). (d) CH-CDF analysis of the human PCD proteins (apoptosis, red circles; autophagy, green circles; and necroptosis, yellow circles). Here, the coordinates of each point were calculated as a distance of the corresponding protein in the CH plot from the boundary (Y-coordinate) and an average distance of the respective CDF curve from the CDF boundary (X-coordinate). The four quadrants correspond to the following predictions: Q1, proteins predicted to be disordered by CH plots, but ordered by CDFs; Q2, ordered proteins; Q3, proteins predicted to be disordered by CDFs, but compact by CH plots (i.e., putative molten globules or mixed proteins); Q4, proteins predicted to be disordered by both methods (i.e., proteins with extended disorder). The values shown next to the quadrant name denote the corresponding color coded fractions of chains from each of the three types of PCD-related proteins

