Figure 3.
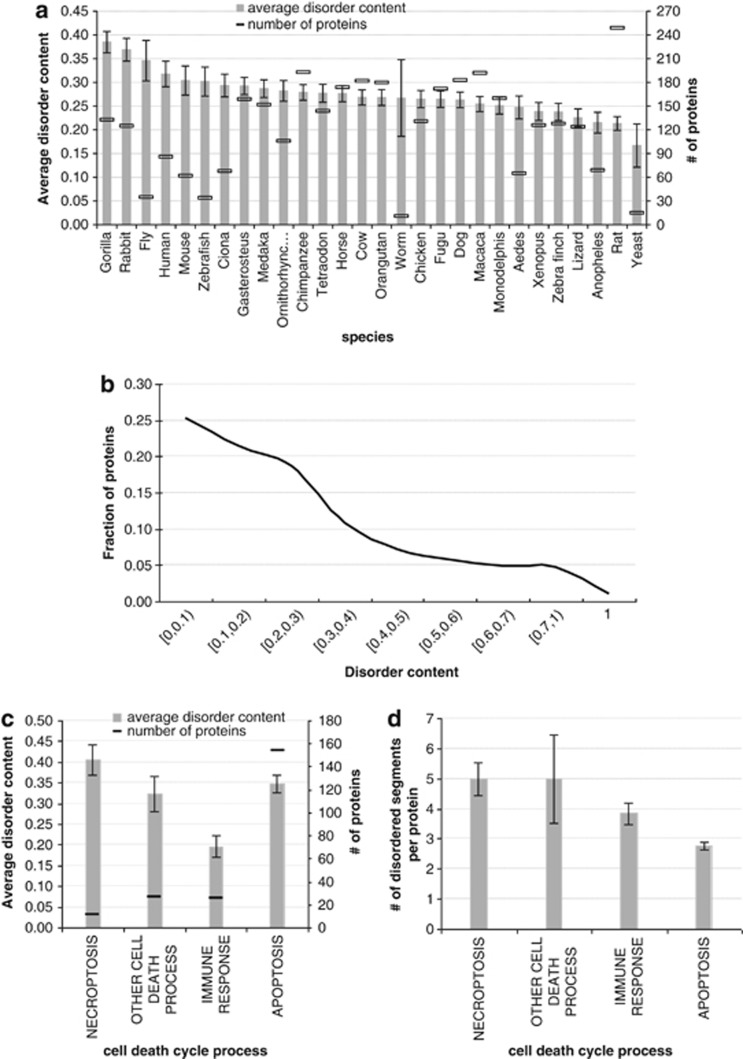
Evaluation of abundance of intrinsic disorder in death-related proteins from the Deathbase. (a) The average disorder content (grey bars) with standard errors (error bars) and the number of proteins for the 28 considered species shown on the x axis. (b) Distribution of disorder content for the cell death proteins for the 28 considered species. (c) The average disorder content (grey bars) with standard errors (error bars) and the number of proteins for different cell death processes. (d) The average number of disordered segments per protein (grey bars) with standard errors (error bars) for different cell death processes

