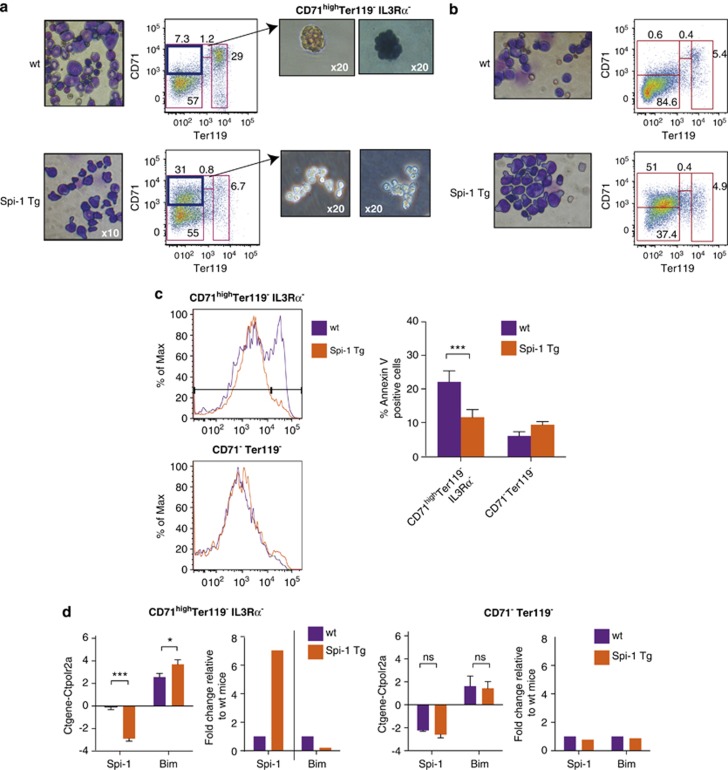
Figure 4.
Spi-1 decreases Bim expression and prevents apoptotic death in vivo. (a and b) Cytospin preparations of cells from bone marrow (a) and spleen (b) of wt and Spi-1 transgenic (Spi-1 Tg) mice with erythroleukaemia were stained with May–Grünwald–Giemsa (left panels). Images were acquired with an × 10 objective lens (Nikon Eclipse TE300 microscope, Champigny-Sur-Marne, France). Representative fluorescence profiles of cells incubated with antibodies against Ter119 and CD71 are shown. Dead cells were excluded by DAPI positivity. Sorted CD71highTer119−IL3Rα− cells were plated on methylcellulose supplemented with FBS and EPO and CFU-Es from wt bone marrow were examined at day 3. Haemoglobinized cells were detected by staining with 0.2% benzidine (right panels). (c) Representative flow cytometric profiles of living CD71highTer119− IL3Rα− and CD71−Ter119− cells (DAPI−) that were Annexin V-positive. The histograms present the mean of eight independent experiments of Annexin V staining in each population. (d) Bim and Spi-1 mRNA levels in CD71highTer119− IL3Rα− (left) and CD71−Ter119− (right) cells from wt and Spi-1 Tg mice were quantified by real-time qPCR and normalized to the Polr2a mRNA level (Ctgene-Ctpolr2a). Bars correspond to the mean ΔCt±S.D. of at least three independent experiments. Statistical analysis of the ΔCt values was carried out by using the Student's t-test; ***P<0.001 and *P<0.05. For easier interpretation, we added on the right the histograms representing the fold change relative to wt mice, calculated from the 2−ΔΔCt. NS, nonsignificant

