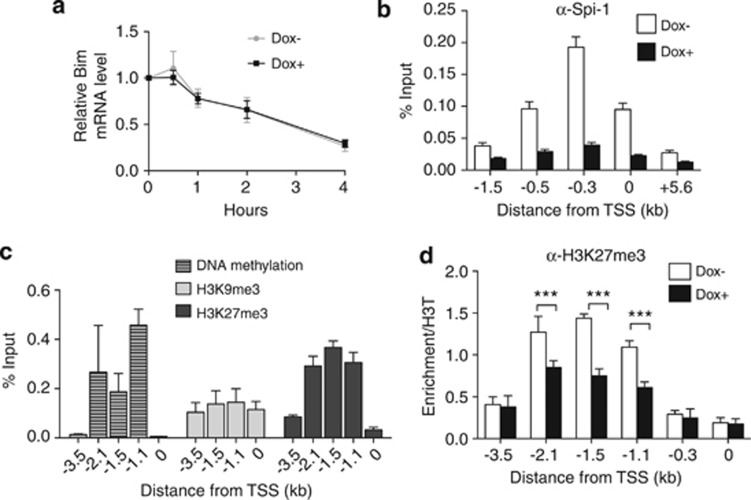
Figure 6.
Spi-1 represses Bim by controlling transcription initiation. (a) ShSpi-1-A2B cells were cultured with or without dox for 24 h and then treated with 1 μg/ml of actinomycin D for the indicated times. Bim mRNA expression was measured by real-time qPCR and normalized to the Gapdh mRNA level. The levels of Bim mRNA in actinomycin D-treated cells are relative to the levels in untreated cells. The graph corresponds to the mean±S.D. of at least three independent experiments. (b) Chromatin from shSpi-1-A2C and shSpi-1-A2B cells cultured with or without dox for 72 h was immunoprecipitated using an anti-Spi-1 antibody. Immunopurified DNA was quantitated by real-time qPCR using primers that amplify the regions of the Bim promoter located at the indicated distance from the TSS. Bars represent the mean±S.E.M. of at least five independent experiments. (c) Chromatin and DNA isolated from shSpi-1-A2C and shSpi-1-A2B cells were sonicated and methylated DNA or DNA associated with H3K27me3 or H3K9me3 was immunoprecipitated. The same primer pairs were used to amplify the Bim promoter regions to assess H3K27me3, H3K9me3 and DNA methylation. The histogram bars represent the enrichment relative to the Input (%Input) determined by real-time qPCR. The mean±S.D. of at least three independent experiments are shown. (d) Chromatin from shSpi-1-A2C cells cultured with or without dox for 72 h was immunoprecipitated using an anti-H3K27me3 antibody. The %Input was normalized to the enrichment obtained with the anti-histone 3 antibody. Immunopurified DNA was quantitated by real-time qPCR using primers that amplify the regions of the Bim promoter located at the indicated distance from the TSS. The bars represent the mean±S.E.M. of at least four independent experiments. ***P<0.001 by analysis of variance (ANOVA) test followed by post hoc test (pairwise t-test adjusted for multiple tests)

