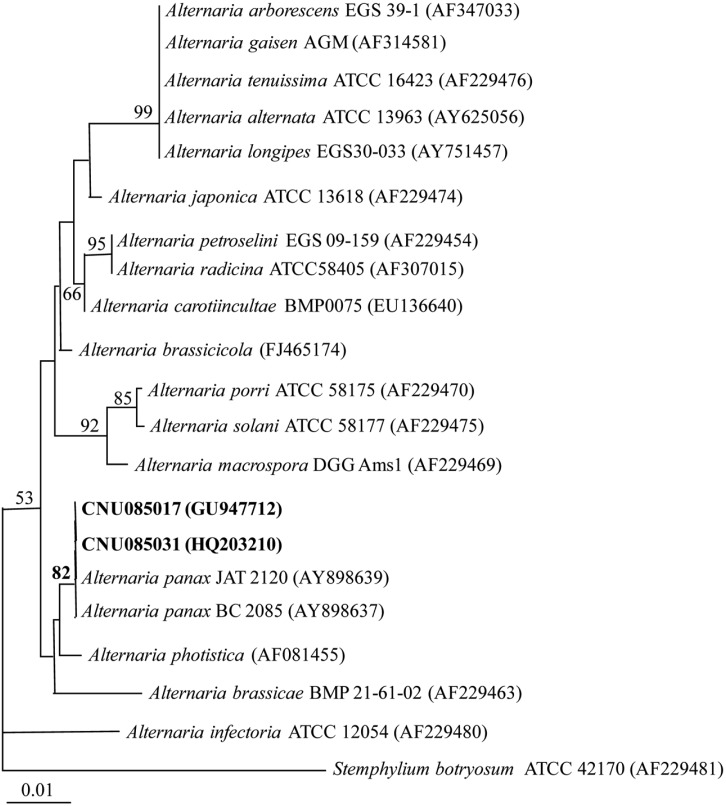
Fig. 3.
Neighbor-joining tree based on sequence analysis of the internal transcribed spacer (ITS) region (ITS5/ITS4). Numbers close to the branch indicate bootstrap values obtained from 1,000 bootstrap replicates. Bar indicates the numbers of nucleotide substitutions per site. Accession numbers of GenBank are provided in parentheses.

