Fig. 5.
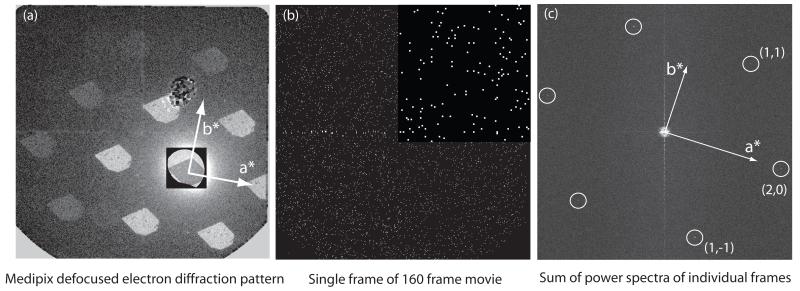
- defocused electron diffraction pattern of a crystal viewed on the Medipix II-Quad detector. Some of the pixel defects in the detector including a large damaged area just above the centre can be seen. The 6 diffraction spots at 4Å as well as all the higher resolution spots are clearly visible, showing the sharp outline of the crystal and all areas diffracting well. The central square area has been rendered at a lower level to show the much stronger direct beam and the bright field image of the crystal.
- single frame from a 160-frame sequence, with a magnified insert at the top right, showing the individual pixels that have received a single count and the majority of pixels with no counts. Each frame in the series (para_22may_image07) had an exposure of 5000 electrons, corresponding to ~0.006 el/Å2.
- transforms added together to show the diffraction spots. The calculation in this case was carried out by summing the 32 power spectra of a 5-frame running average. This was one of the few images that showed spots in all three directions. Others showed two or only one diffraction spot despite the visualization of all three pairs of spots during the initial crystal selection step. The background is much higher when intensities from individual frames are summed, rather than amplitudes being summed as in a single image where the dose has not been fractionated, so the signal-to-noise ratio of the spots is lower. Note that the summing of intensities in this way does not affect the measurement of Ig/I0 and avoids the need to determine the image shifts due to stage drift between frames that builds up over the extended several minute duration of the exposure.

