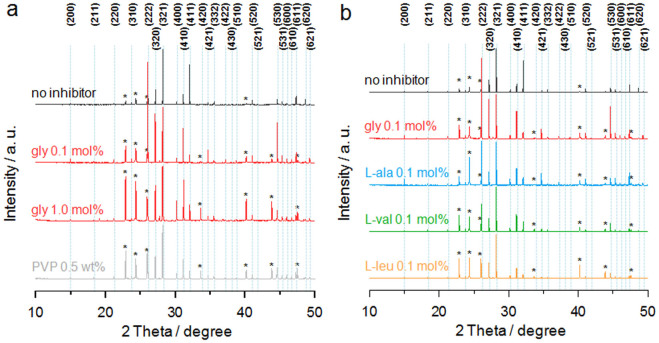
Figure 4. PXRD patterns of the CO2 hydrates in the presence of hydrophobic amino acids.
Synchrotron PXRD patterns for CO2 hydrate (a) with glycine or PVP and (b) with hydrophobic amino acids. Diffraction peaks for cubic structure I hydrate are denoted by their Miller indices, and asterisks indicate the peak positions for the ice phase. All diffraction peak intensities were therefore normalized to the (321) peak in order to enable a comparison of their relative intensities.

