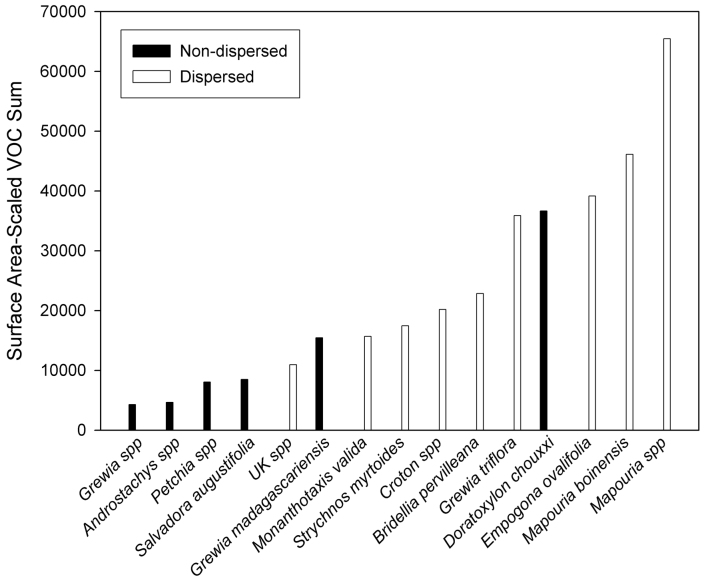
Figure 2. Volatile organic compound emission intensity of dispersed and non-dispersed fruits.
Frequency distribution of surface-area-scaled volatile organic compound (VOC) emissions of dispersed and non-dispersed fruits. Surface-area-scaled VOC emission intensity is determined by integrating areas under gas chromatography-mass spectrometry (GC-MS) chromatograms, and scaling GC-MS chromatograms by the total surface area of all fruits sampled.

