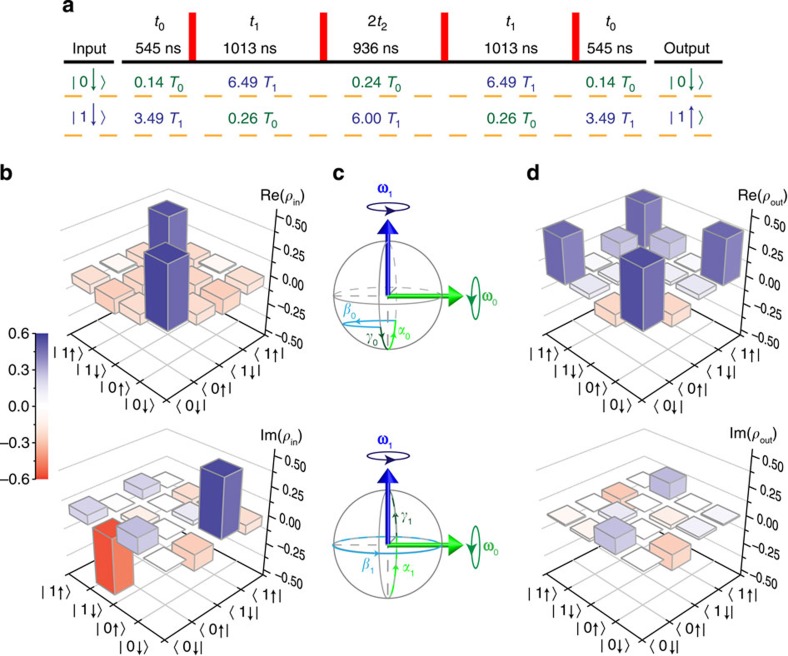
Figure 3. Implementing the CeNOTn by DD.
The effect of the gate is studied by performing state tomography on the system before and after the gate. (a) The DD pulse sequence for realizing the CeNOTn gate. The numbers in the first line indicate the time intervals between the flips of the NV centre spin, and the numbers in the second and third lines are the intervals in units of T0≡2π/ω0 (green) or T1≡2π/ω1 (blue), the precession periods of the nuclear qubit for the electron qubit in the |0 or |1
or |1 state. (b) State tomography for the initial state
  . The bars are coloured according to the corresponding entries in the measured density matrices, with blue and red representing positive and negative values, respectively. (c) Schematic of the conditional evolution of the
  (upper panel) and
  (lower panel) states steered by the DD. The conditional quantization axes of the nuclear qubit, ω0 and ω1 are represented by green and blue arrows, respectively. With
  , the nuclear spin first precesses about ω0 and alternates between ω0 and ω1 under the DD gate sequence. The nuclear qubit traces out the path α0−β0−(γ0+α0)−β0−γ0 under the sequence t0−t1−(t2+t2)−t1−t0 and returns to the original state at the end of the sequence. For
  , the nuclear spin first precesses about ω1 for t0. It then evolves during t1−2t2−t1 along the path α1−β1−γ1 and is hence flipped. (d) State tomography of the output Bell state for the initial state in b (same colour scale). The resultant state fidelity is measured to be 0.91(1).

