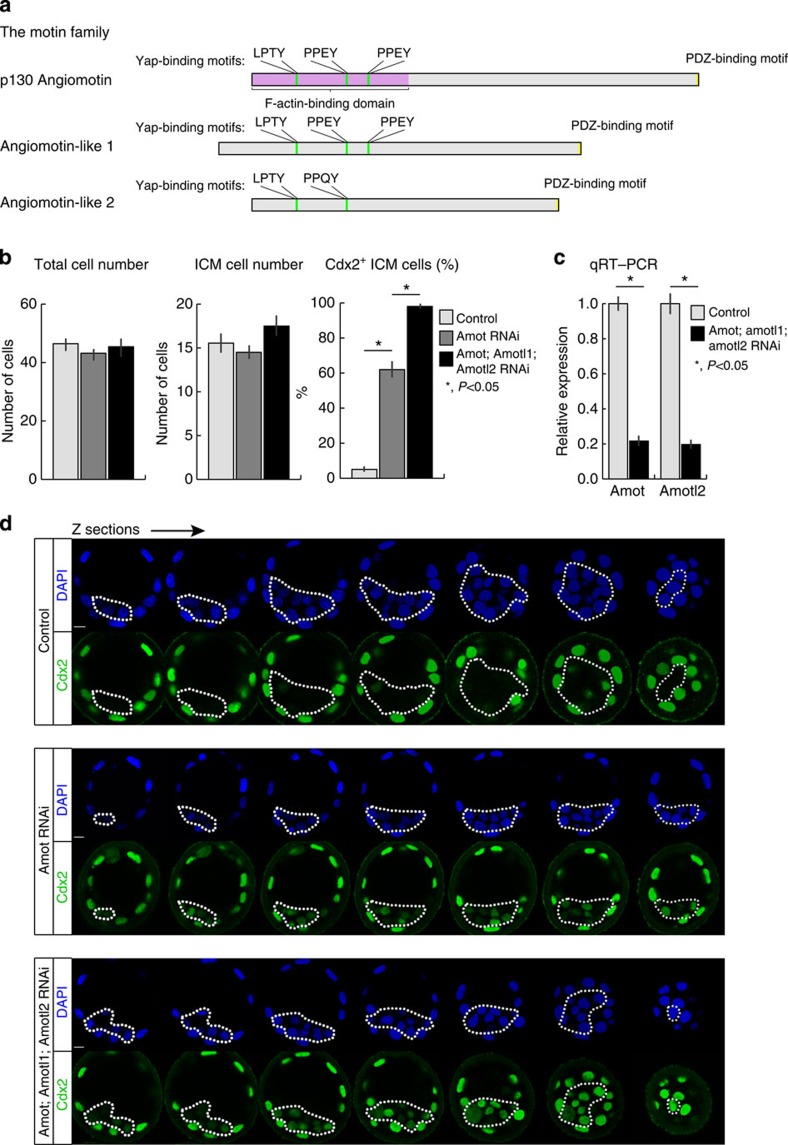
Figure 3. Co-depletion of motin family members enhance ICM differentiation.
(a) The motin family proteins with key regions outlined. (b) Total cell number and ICM cell number are not significantly different between control (N=21), Amot-RNAi (N=31) and Amot; Amotl1; Amotl2-RNAi (N=12) blastocysts. However, in the triple motin-RNAi embryos, 98.0±1% of ICM cells of the triple RNAi embryos were Cdx2 positive at the blastocyst stage (N=210 cells, 12 embryos) compared with the 61.8±5% of Amot-RNAi (N=434 cells, 30 embryos) and 5.0±2% of control embryos (N=311 cells, 21 embryos). Error bars represent s.e.m. Student’s t-test was used to test significance. (c) qRT–PCR of whole embryos, comparing expression levels of Amot and Amotl2 in control embryos (N=21) and triple knockdown embryos (N=21). Amot and Amotl2 were downregulated to 21.6±3% and 19.6±3%, respectively, relative to control levels. Amotl1 expression could not be detected. Error bars represent s.e.m. Student’s t-test was used to test significance. (d) Z-section series of immunofluorescent confocal images of control, Amot-RNAi (N=30) and Amot; Amotl1; Amotl2-RNAi (N=12) blastocysts, with the highest proportion of Cdx2-expressing cells in the triple knockdown. Dotted lines outline the ICM. Scale bar,: 10 μm.

