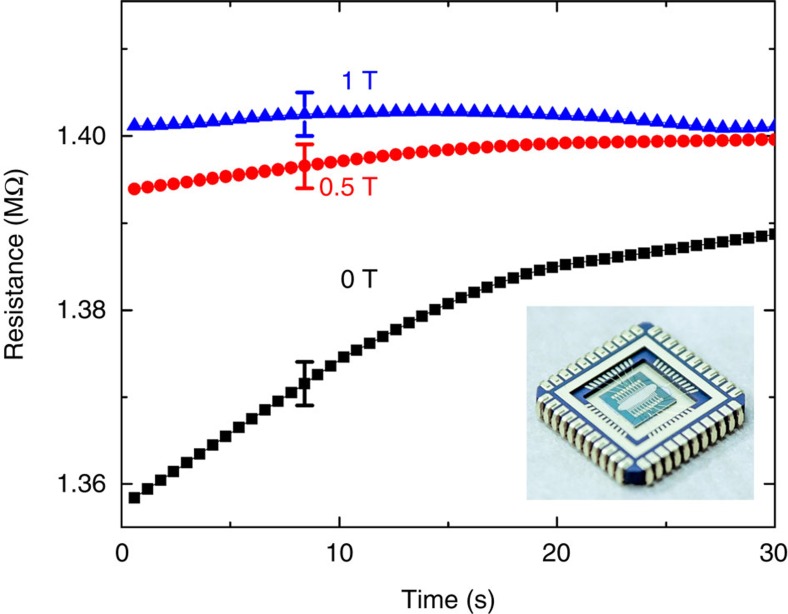
Figure 4. The time dependence of the device resistance at 2 K.
The black square line represents the resistance increase when the current is driven through the chiral layer at a constant voltage of −2.5 V. At 0.4 T (0 A), we achieve similar resistance as the maximum resistance measured by the spin-filter effect using −2.5 V. The red circle (blue triangle) line is the same measurement under a 0.5 T (1 T) magnetic field parallel to the current direction. The inset shows an optical microscopy picture of the measured device. Error bars indicate the maximum fluctuation of the measuring device.

