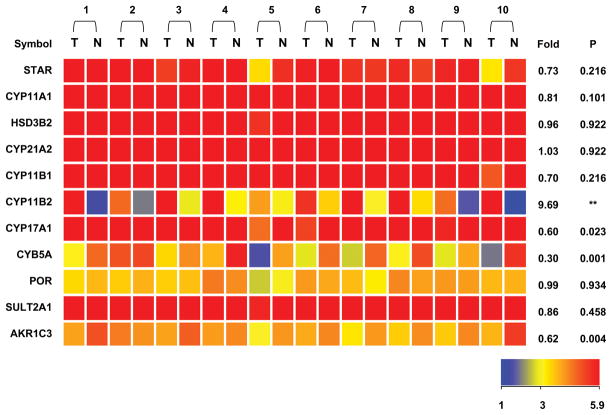
Figure 3.
Comparison of steroidogenic enzyme transcripts in APA-AAG pairs using a heatmap derived from microarray analysis. RNA from 10 APA–AAG pairs was used for microarray analysis on 20 arrays. The heatmap color indicates the expression value of each gene in the corresponding sample based on the log2 of signal strength (see color bar). The mean fold-induction of each APA-AAG pair is also provided with P value between APA and AAG using paired t test. (n=10) Patient pairs are grouped by the indicated numbers. (** indicate a P value less than 0.001, T = APA; N = AAG)

