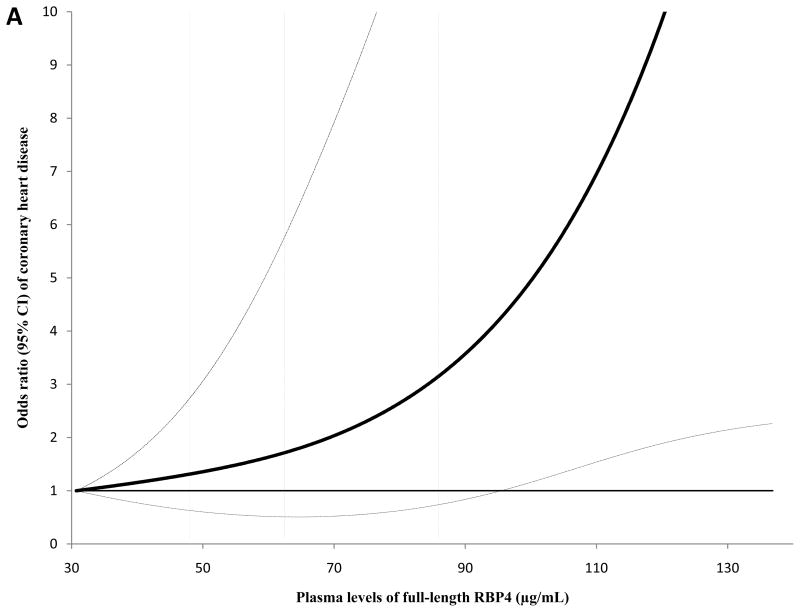
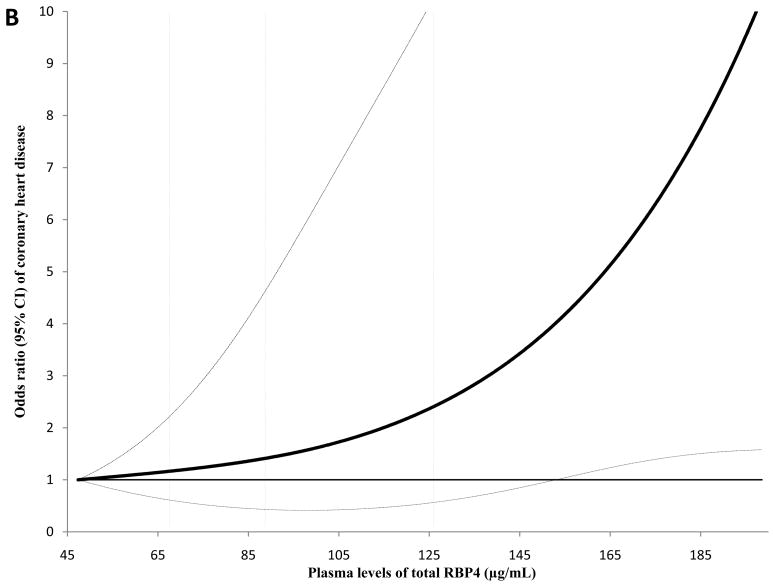
Figure 2.
Odds ratio of coronary heart disease (95% CI) by levels of full-length and total RBP4 in the first 8 years of follow-up. In this analysis, study participants with the lowest and highest 5% of RBP4 levels were excluded to minimize potential impact of outliers. Multivariate conditional logistic regression models were adjusted for the same set of covariates for model 2 in Table 3a. Solid lines are ORs and dashed lines are 95% CIs. The dotted vertical lines represent the cut-off points for making quartiles listed in Table 3a. A, full-length RBP4; B, total RBP4.


