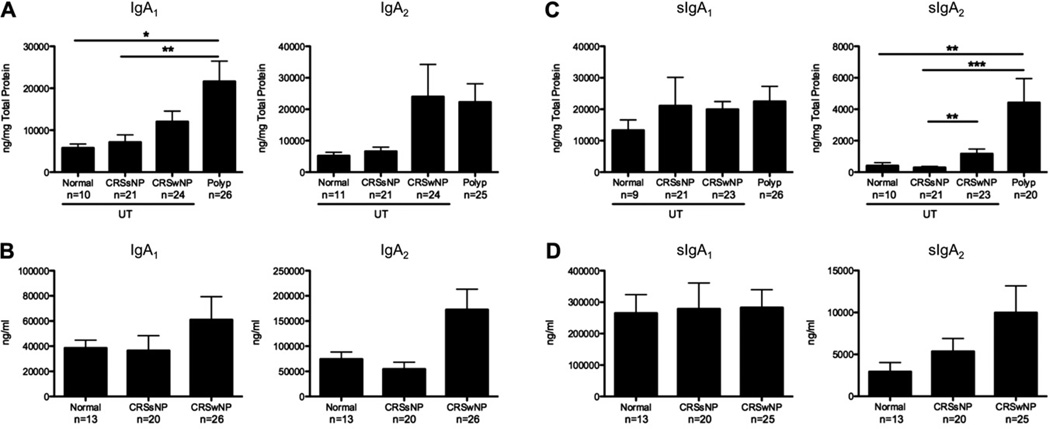
FIG 4.
Differential expression of IgA1 and IgA2 in NPs. Total IgA1 and IgA2 levels in tissue extracts (A) and nasal lavage fluid (B) are shown. sIgA1 and sIgA2 levels in tissue extracts (C) and nasal lavage fluid (D) are shown. Data represent means ± SEMs. *P < .05, **P < .01, and ***P < .001, Kruskal-Wallis test.

