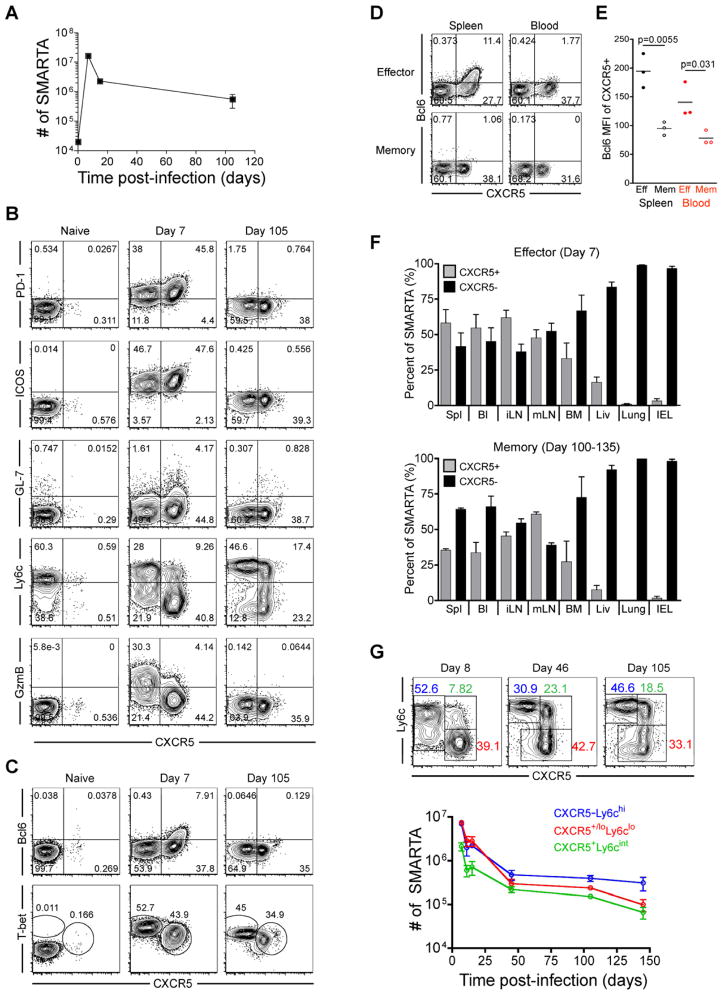
Figure 1. Phenotypic heterogeneity of virus-specific CD4+ T cells is maintained during effector and memory differentiation.
2×10⁵ CD45.1+ LCMV-specific naive SMARTA transgenic CD4+ T cells were adoptively transferred into CD45.2+ naïve recipients that were then infected with 2×10⁵ PFU of LCMV Armstrong. FACS plots are gated on CD4+CD45.1+ SMARTA cells at the indicated timepoints relative to infection. A) Kinetics of splenic SMARTA CD4+ T cells. B) CXCR5, PD-1, ICOS, GL-7, Ly6c, and granzyme B analysis of naïve, effector, and memory SMARTA CD4+ T cells. C) Analysis of T-bet and Bcl6 expression. D) Analysis of Bcl6 and CXCR5 on effector (Day 8) and memory (Day 100–133) SMARTA cells in blood and spleen. E) Bcl6 MFI of CXCR5+ gated effector and memory SMARTA cells. Statistically significant p values are shown, and were determined using a two-tailed unpaired Students t test. F) The frequency of effector and memory SMARTA cells that are CXCR5+ and CXCR5− in the following tissues: Spl=spleen; Bl=blood; iLN=inguinal lymph node; mLN=mesenteric lymph node; BM=bone marrow; Liv=liver; Lung, and IEL=intestinal intraepithelial lymphocytes. Graphs show the mean and s.e.m. N=3 mice at each timepoint. G) Plots of CD4+CD45.1+ gated SMARTA cells with gates indicating the Ly6c+CXCR5− (blue), CXCR5+Ly6clo (red), and CXCR5+Ly6cint (green) subsets. Chart indicates the number of each subset in spleen following infection (N≥3 at each timepoint). Error bars represent the SEM. See also Figure S1 and Table S1.

