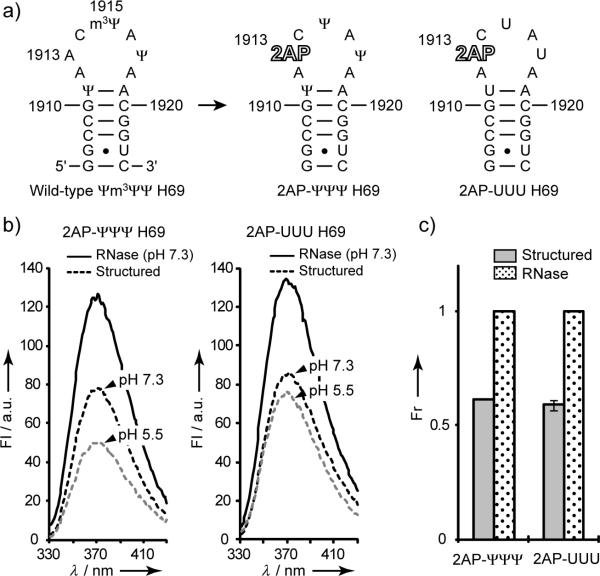
Figure 1.
(a) Secondary structure of E. coli H69 and 2AP-H69 RNAs. (b) Fluorescence data for 2AP-ΨΨΨ and 2AP-UUU before (dashed) (pH 5.5 and 7.3) and after (solid) (pH 7.3) RNase A treatment. (c) Relative fluorescence intensities (normalized to RNase A data) at the emission maximum (370 nm) (1.5 μm RNA in 20 mm K+-cacodylate, 70 mm NH4Cl, and 30 mm KCl; FI is fluorescence intensity (arbitrary units), and Fr is relative fluorescence intensity).

