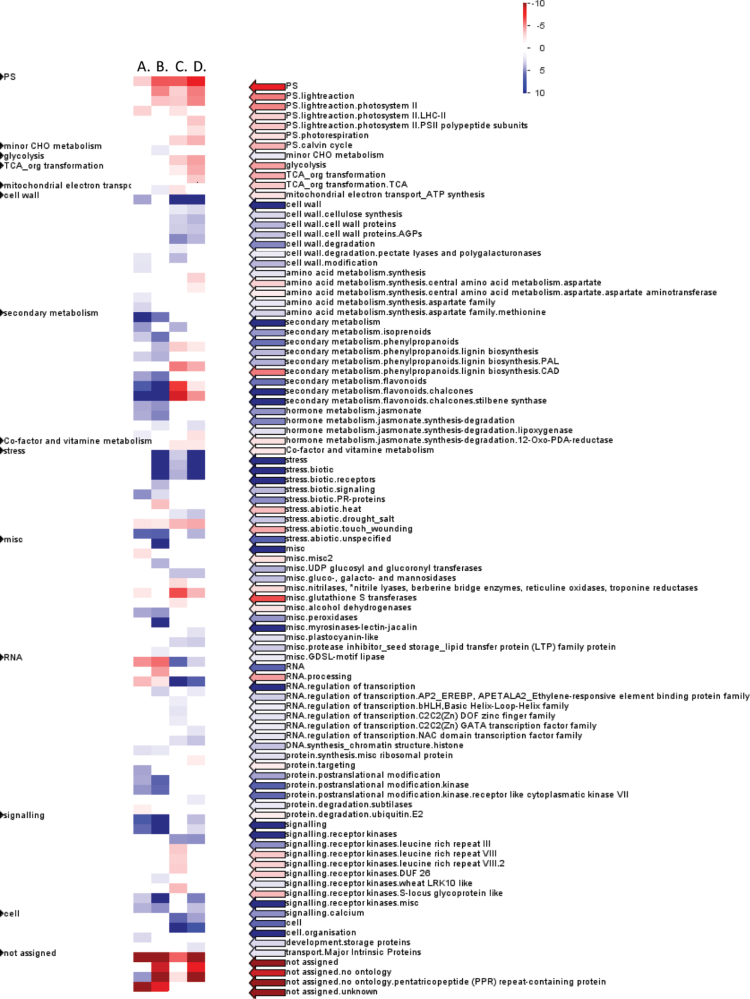
Fig. 4.
Pageman visualization of MapMan functional categories enriched in the genes differentially expressed between the callus and rootstock tissue (A) 3 d and (B) 28 d after grafting, and in the (C) rootstock and (D) callus tissue from 3 d to 28 d after grafting. The degree of enrichment of functional categories in up- and down-regulated genes is given by shades of blue and red, respectively.

