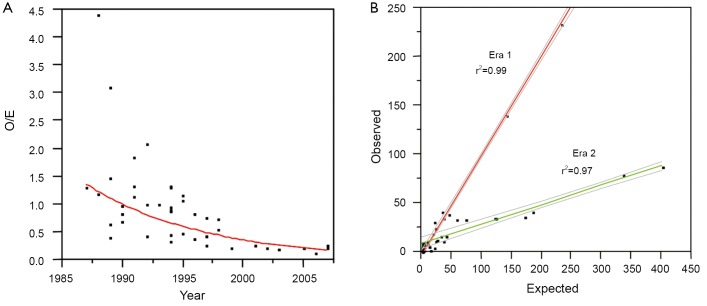
Figure 5.
(A) We have modeled approximately 16,000 patients from clinical reports. A plot of the decline in O/E ratios for paraplegia over time shows a significant decline that can be divided into 2 distinct eras as shown in (B). The improvements in era 2 are not well documented in the reports themselves

