
Figure 3.
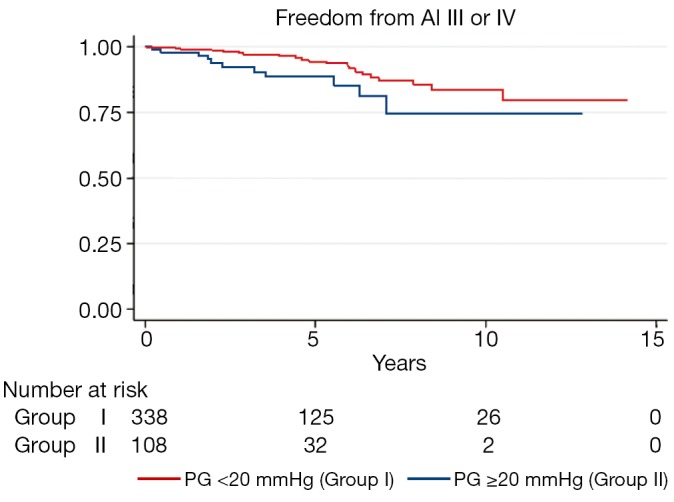
Kaplan-Meier curve showing the difference in freedom from aortic insufficiency ≥2+ between Group I (PG <20 mmHg) and II (PG ≥20 mmHg) at different time periods
Official websites use .gov
A
.gov website belongs to an official
government organization in the United States.
Secure .gov websites use HTTPS
A lock (
) or https:// means you've safely
connected to the .gov website. Share sensitive
information only on official, secure websites.
Kaplan-Meier curve showing the difference in freedom from aortic insufficiency ≥2+ between Group I (PG <20 mmHg) and II (PG ≥20 mmHg) at different time periods