
Figure 6.
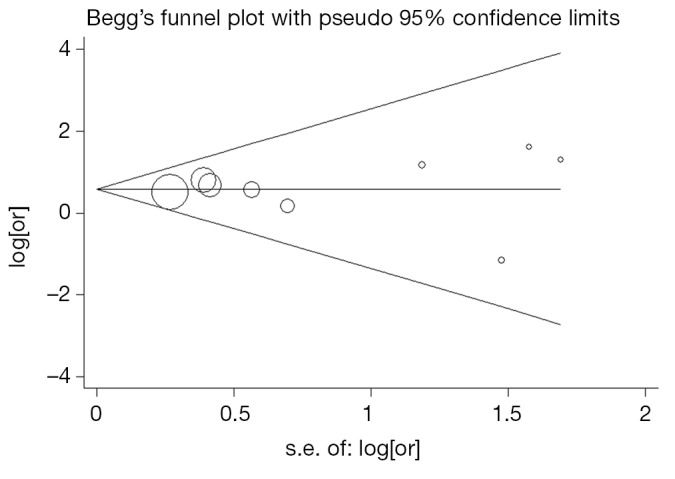
Funnel plot for the meta-analysis of permanent neurological deficit comparing DHCA vs. MHCA+SACP as neuroprotective strategies in all 9 included studies. Log of odds ratio comparing PND (vertical axis) is presented against the standard error (SE) of the log of OR (horizontal axis). The SE inversely corresponds to study size. Asymmetry of the plot can indicate publication bias