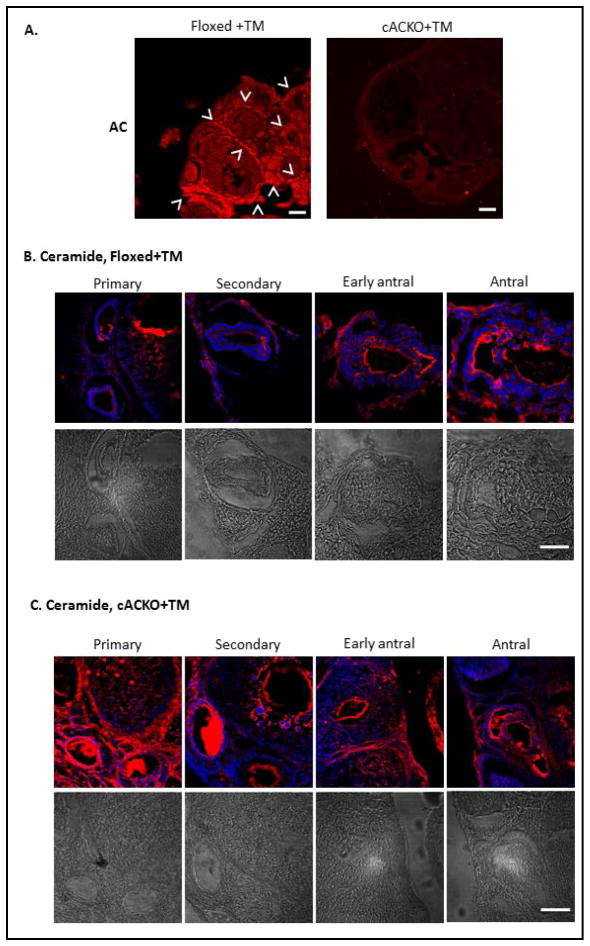
Fig. 6.
Reduced AC and elevated ceramide in the ovaries of TM-treated cACKO compared to Floxed mice. (A) High AC expression was observed by immunostaining in the ovaries of TM-treated Floxed mice. Arrowheads indicate the theca cells, where AC expression was most prominent. In contrast, AC expression levels were markedly reduced in the ovaries of TM-treated cACKO mice. AC was visualized using a fluorescent second antibody Cy-3 and laser-scanning confocal microscopy. Scale bars indicate 50 microns. Images are representative of more than three independent immunostaining experiments. (B,C) Confocal analysis of ceramide in TM-treated Floxed and cACKO mice. Ceramide was highly elevated in the primary and secondary follicles of TM-treated cACKO (C) compared to Floxed animals (B). Scale bars = 10 microns. Images are representative of three independent immuno-staining experiments. Representative follicles of each stage are shown. Light microscopic images are provided below the immunostained images.

