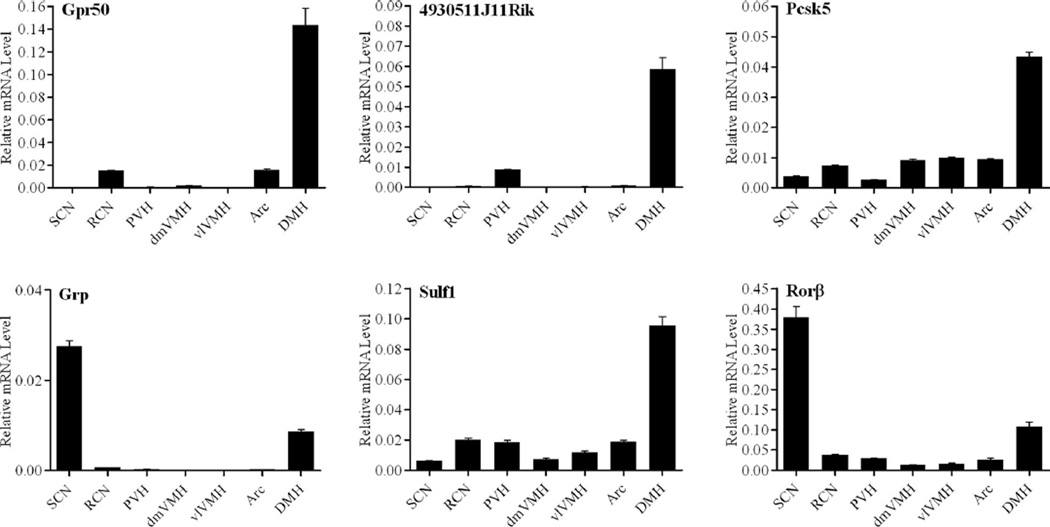
Figure 3.
Relative distribution of candidate genes across the hypothalamus. Graphs are representative of duplicate experiments. Values are plotted as the mean of triplicate measurements ± standard deviation error bars. Arc, Arcuate nucleus; DMH, dorsomedial hypothalamus; dmVMH, dorsomedial ventromedial hypothalamic nucleus; PVH, paraventricular nucleus; RCN, retrochiasmatic nucleus; SCN, supra-chiasmatic nucleus; vlVMH, ventrolateral ventromedial hypothalamic nucleus.

