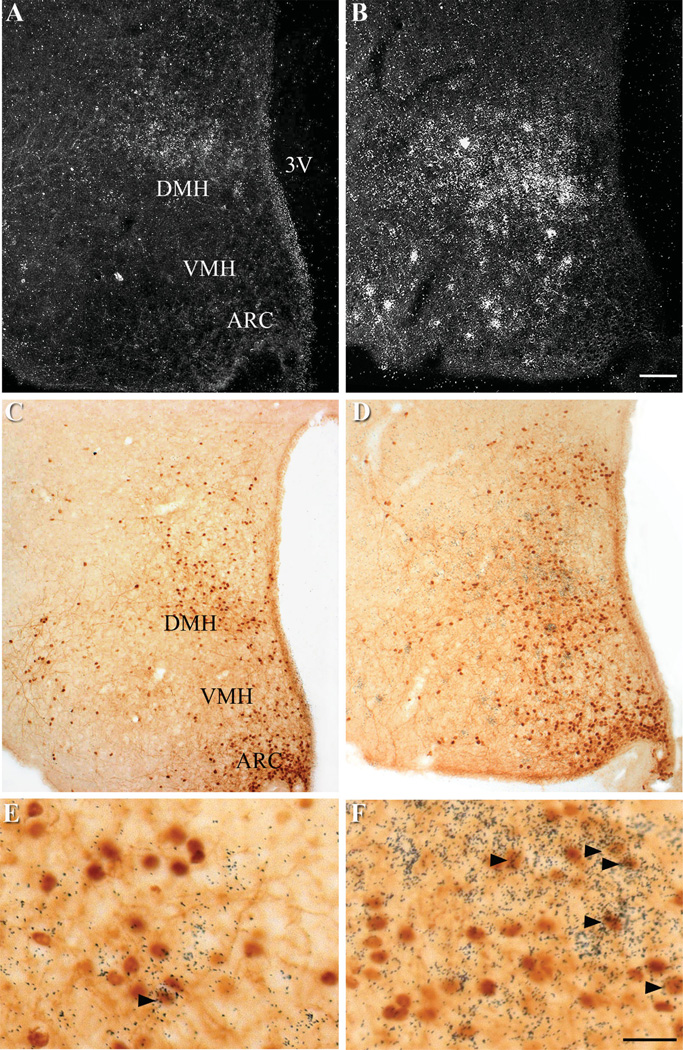
Figure 4.
Distribution of p-STAT3 immunoreactivity and Grp50 and 4930511J11Rik mRNA in the DMH. A,C,E: Gpr50 ISHH with p-STAT3 IHCC. B,D,F: 4930511J11Rik ISHH with p-STAT3 IHCC. mRNA hybridization is represented by silver grains, while p-STAT3 immunoreactivity is represented by brown staining. A,B: Darkfield image. C–F: Brightfield images. The DMH regions of C,D are magnified in E,F. Black arrows indicate examples of neurons doubly labeled with either Gpr50 or 4930511J11Rik riboprobe and anti-p-STAT3 antisera. Scale bars = 100 µm in B; 25 µm in F.

