
Figure 6. MRS Imaging of Prostate Cancer.
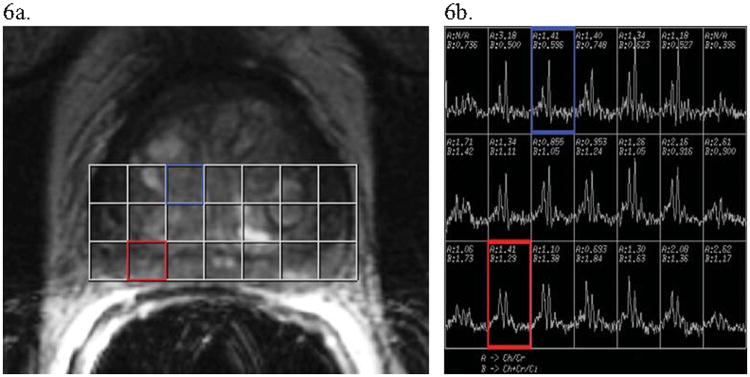
Images and post-image processing data from a man with biopsy-diagnosed prostate cancer. (a) An axial T2-weighted image of a prostate divided into voxels for MRS imaging analysis. (b) The MR spectra for choline+creatine (the first dominant “composite” peak from the left of each spectrum) and citrate (the second dominant peak from the left). The blue voxel incorporating unsuspicious central gland on T2-weighted imaging (a) shows a normal spectrum along with a normal (Cho+Cr)/Cit ratio, with much more citrate than choline+creatine present (see spectrum also boxed in blue in (b)). Alternatively, the red voxel contains peripheral zone prostate which has T2 hypointensity, making it suspicious for cancer (notably, the associated T1 image was negative for hemorrhage). The voxel's associated spectrum (boxed in red in (b)) shows a higher (Cho+Cr)/Cit ratio (approximately equal peaks) than seen in the unsuspicious blue voxel. This indicates a possible region of tumor in the red voxel's region, especially given the suspicious hypointense signal on T2-weighted imaging.