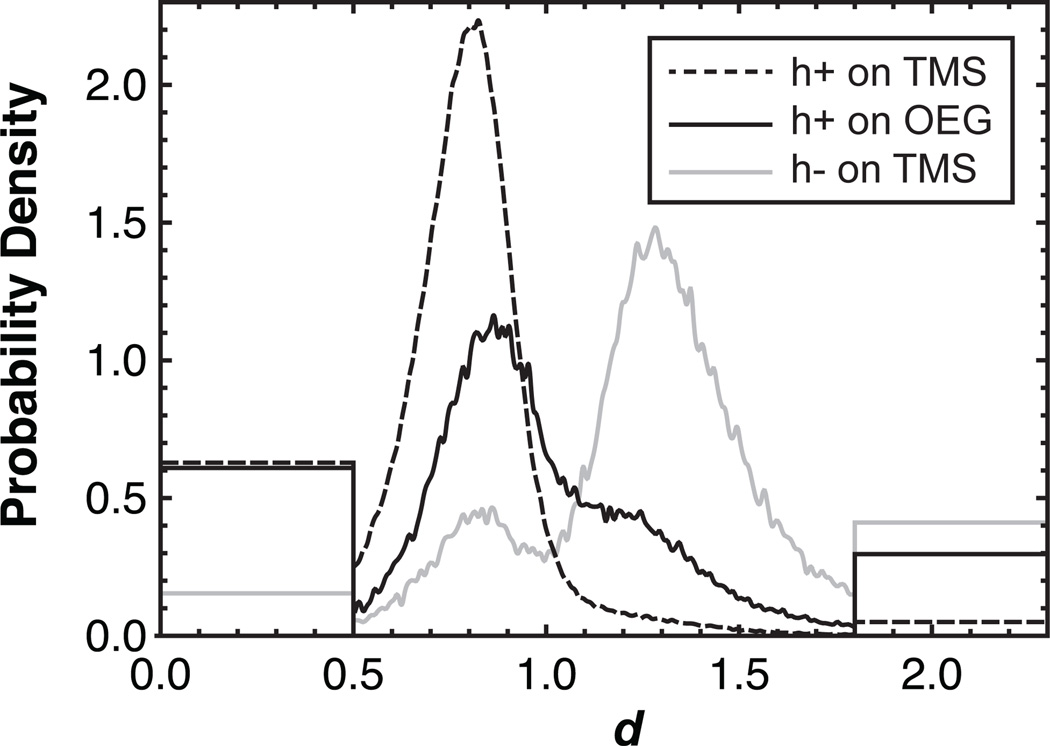
Figure 1.
Surface influence on DNA hairpin formation. The probability density of observing a given relative end-to-end distance is shown for h+DNA on TMS and OEG as well as h−DNA on TMS. The ‘box-like’ ends of the distribution represent molecules that presented essentially zero intensity in one channel or the other, leading to apparent d-values of zero or infinity. This measurement artifact stems from difficulties quantifying low fluorescence intensity in either channel and to account for this we represent these molecules with step distributions at extreme d-values. The area under each ‘box’ is proportional to the number of molecules found in these extreme states and the cumulative area under the ‘boxy’ and ‘smooth’ parts of each distribution integrates to unity.

