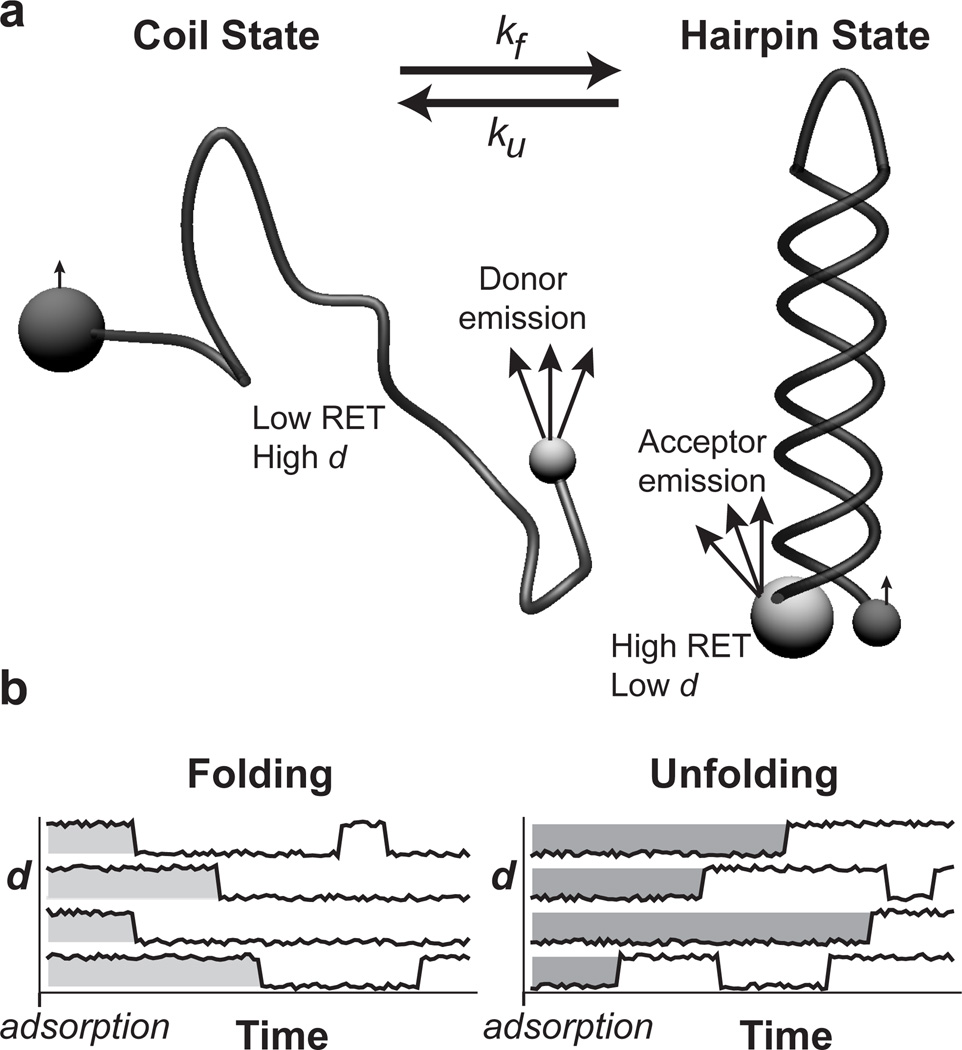
Figure 2.
RET identifies DNA conformation. (a) DNA is end-labeled with two different fluorophores such that RET can be used to distinguish between hairpin and coil states that may interconvert. Small spheres represent donor fluorophores while acceptors are shown as large spheres. Light grey indicates strong fluorophore emission while dark grey indicates weak emission. The hairpin state has a small end-to-end distance that yields high RET efficiency while the majority of coil conformations have large end-to-end distances and low RET efficiency. (b) The distribution of ‘initial-state residence times’ (see Figure 3) is extracted from trajectories of many individual molecules. Molecules are grouped by their initial state in the frame in which they first appear. The initial-state residence time for each molecule is then recorded as the time it takes to convert to the opposite conformational state from its initial state. Subsequent state changes are ignored for reasons described in the Experimental Section.

