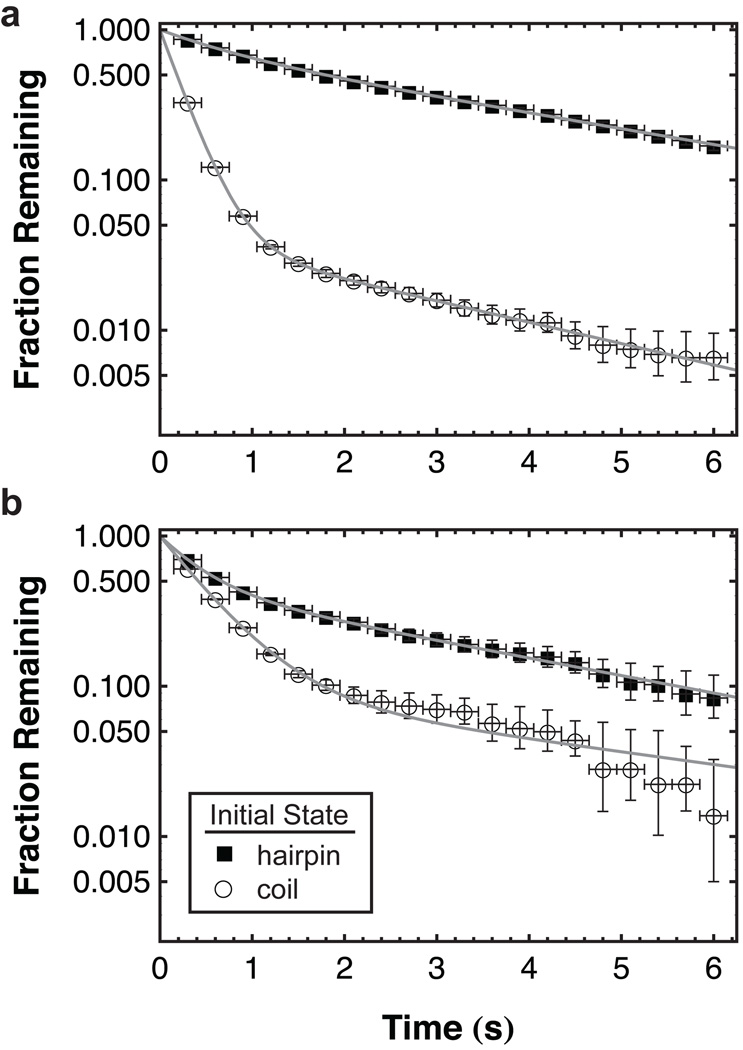
Figure 3.
Kinetics of hairpin folding and unfolding. The integrated probability distribution of initial-state residence times is shown for molecules that are initially either hairpins or coils on (a) TMS and (b) OEG. From these distributions, the rate constants for folding and unfolding processes are extracted. Horizontal error bars represent uncertainty in assigning the initial-state change time due to finite time resolution. Vertical error bars are based on the number of observations that each data point represents (i.e. the number of initial-state residence times observed greater than a given time). From this number of observations, 68% confidence intervals were determined for a Poisson distribution in order to determine the percentage of error. Fits are shown for each dataset using equation 3 with N=2.

