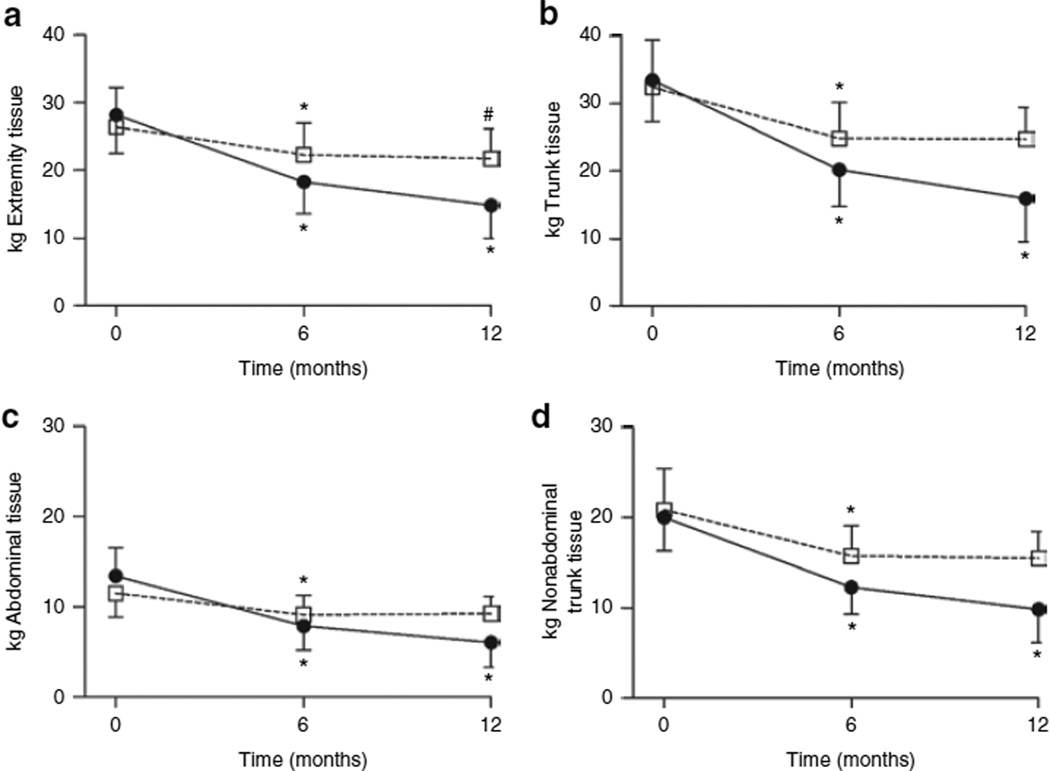
Figure 2.
Changes in regional fat and lean tissue mass after gastric bypass surgery. Data are expressed as mean ± s.d. for fat (closed circles) and lean (open squares) tissue mass in the (a) extremities, (b) trunk, (c) abdomen, and (d) nonabdominal trunk at baseline (time 0 months), and at 6 and 12 months after surgery. *P < 0.0001 and #P = 0.006, baseline vs. 6 months and 6 months vs. 12 months.

