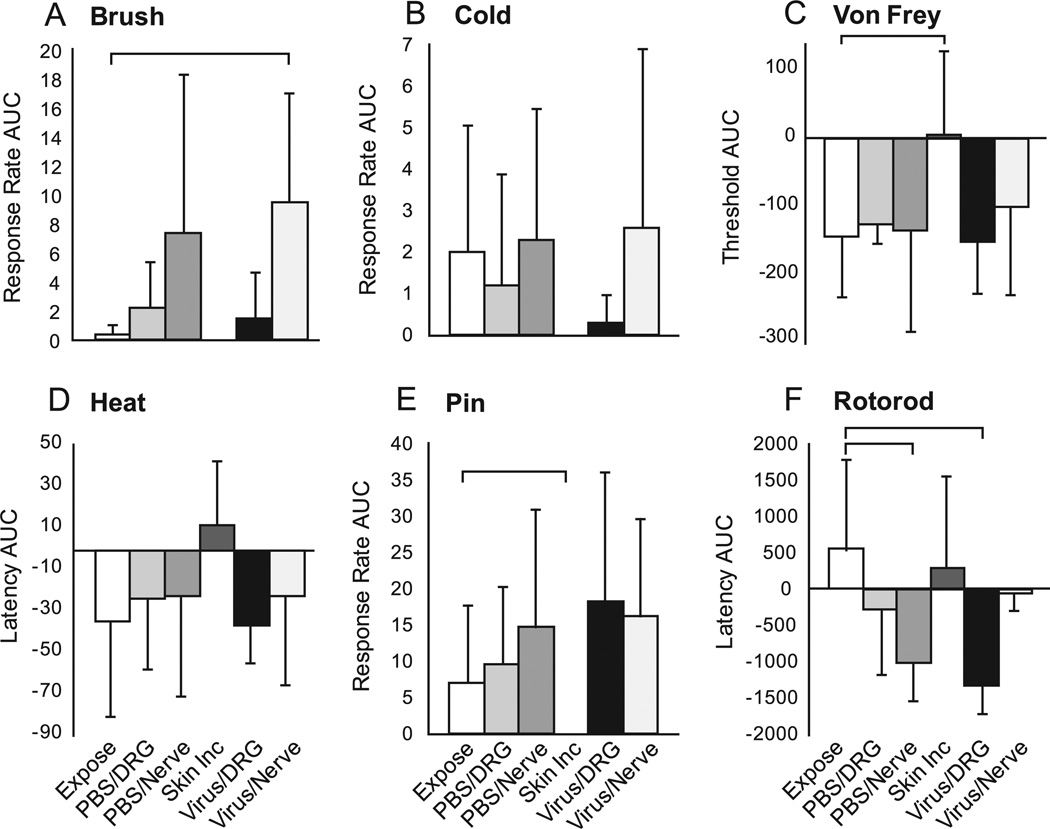
Fig. 3.
Sensory and motor function following surgery and injections evaluated using the area under the curve (AUC) across time for measures normalized to the baseline (day 0, d0). The groups are the same as defined for Fig. 2. Brackets indicate significant differences by Mann-Whitney (U-test for comparisons between Exposure and each other group. Mean ± SD. Group sizes are n = 5 animals.

