
Figure 3.
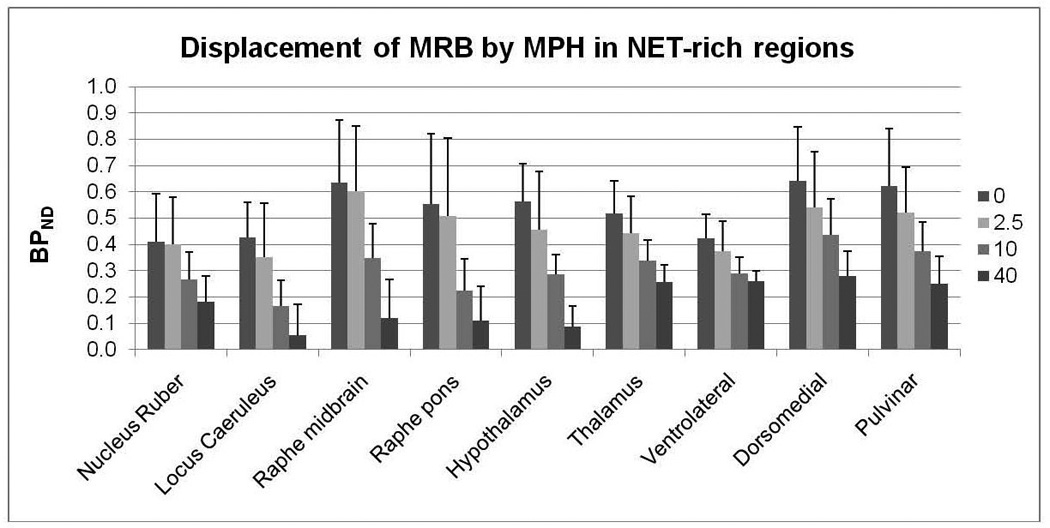
Dose-dependent displacement of [11C]MRB by MPH in NET-rich regions. Each cluster of bar graphs denotes, from left to right, mean BPND at baseline (dark gray), after MPH 2.5 mg (light gray), 10 mg (gray), and 40 mg (black). Error bars denote standard deviation.