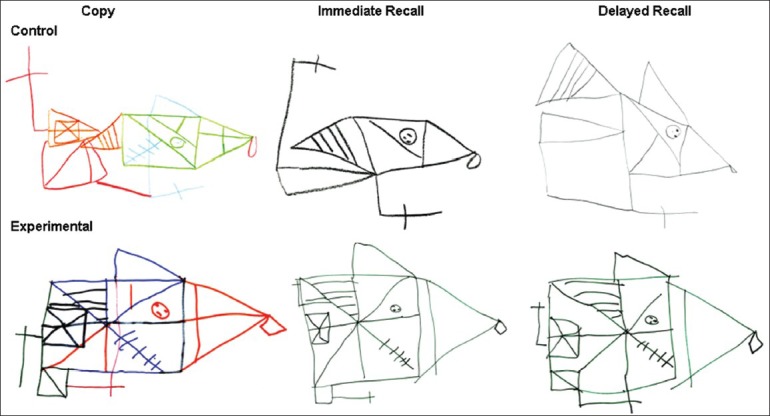
Figure 3.

Rey-Osterrieth complex figure. The figure represents sample drawings from 2 study children, 1 from the Control group, a 9 year 3 month old born at 31 w 1 d GA; and 1 from the Experimental group, a 8 year 4 month old born at 31 w 4 d GA. The conditions displayed are from left to right: Copy, Immediate Recall, and Delayed Recall
