
Figure 1.
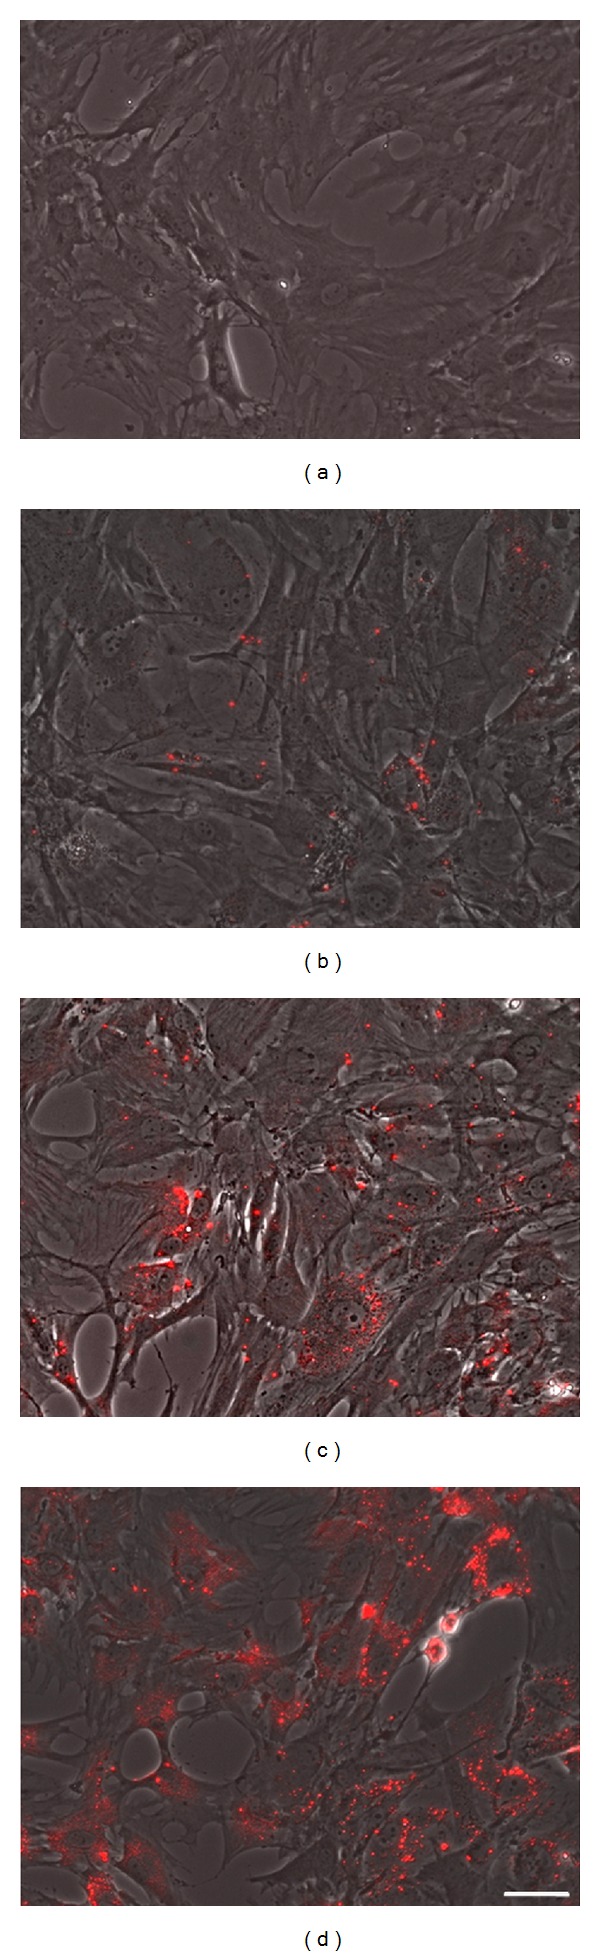
Fluorescence intensity and distribution of QD treated living stem cells 24 h after labeling. (a) Control without QDs, (b) 5 nM QDs, (c) 10 nM QDs, and (d) 20 nM QDs. Scale bar represents 50 μm.
Official websites use .gov
A
.gov website belongs to an official
government organization in the United States.
Secure .gov websites use HTTPS
A lock (
) or https:// means you've safely
connected to the .gov website. Share sensitive
information only on official, secure websites.
Fluorescence intensity and distribution of QD treated living stem cells 24 h after labeling. (a) Control without QDs, (b) 5 nM QDs, (c) 10 nM QDs, and (d) 20 nM QDs. Scale bar represents 50 μm.