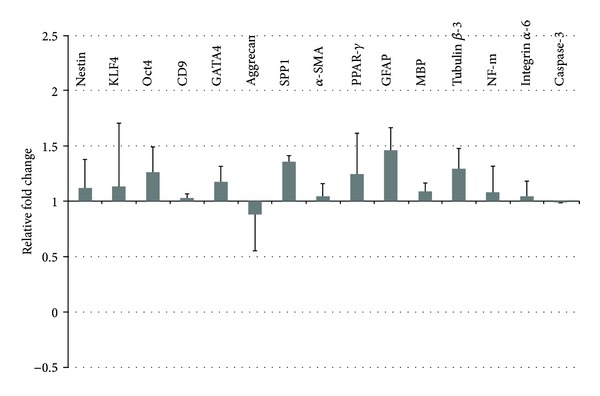
Figure 10.

The transcriptional activity of QD labeled stem cells was analyzed by quantitative PCR and set in relation to untreated control approaches (representing the value “1”). Changes in gene expression are displayed as upregulation (>1) and downregulation (<1). Standard deviations were calculated from two experiments. Transcripts related to stem cells (Nestin, KLF4, Oct4, CD9), endodermal cells (GATA4), mesodermal cells (Aggrecan, SPP1, α-SMA, PPAR-γ), and ectodermal cells (GFAP, Tubulin β-3, NF) were analyzed. Also the mRNA expression level of the surface protein Integrin alpha-6 and the apoptosis marker caspase-3 was estimated.
