
Figure 3.
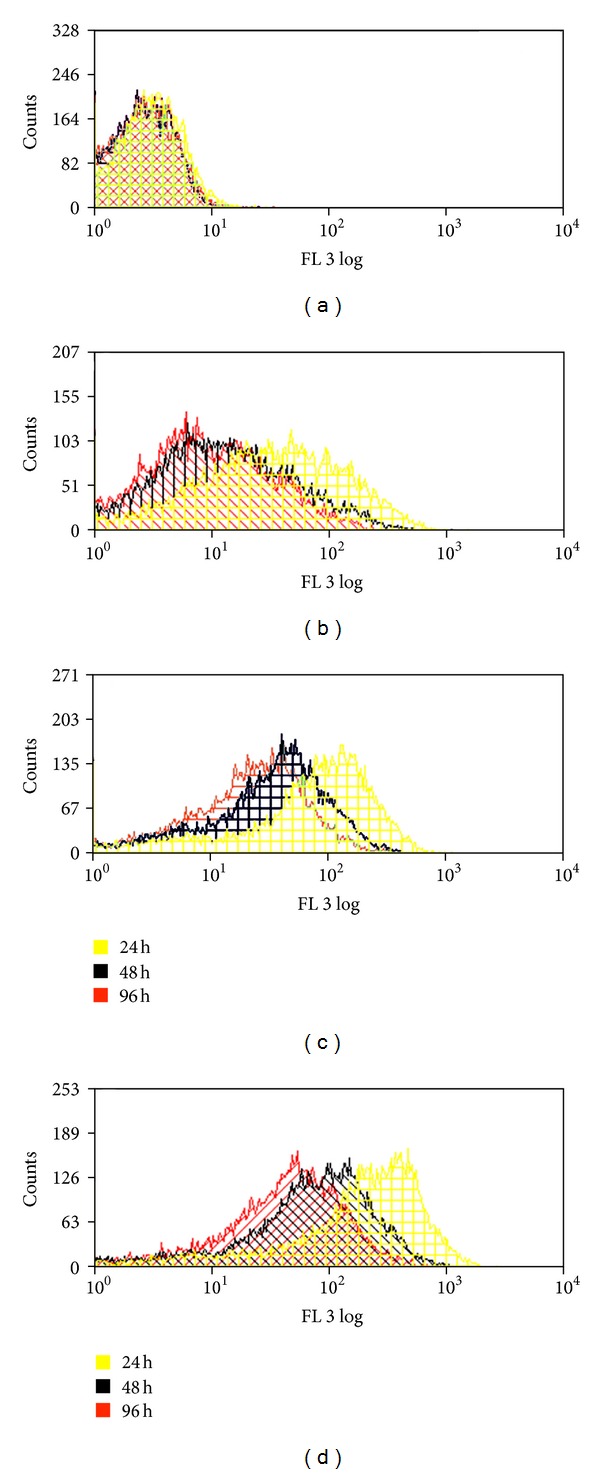
FACS analysis of QDs cell load over cultivation time. The fluorescence per cell was analysed after 24 h, 48 h, and 96 h. (a) Control cells without QDs, (b) cells labeled with 5 nM QDs, (c) cells labeled with 10 nM QDs, and (d) cells labelled with 20 nM QDs.