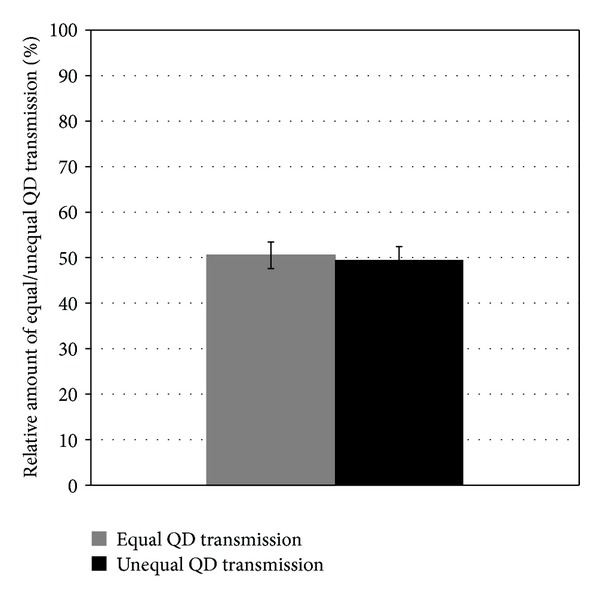
Figure 7.

Distribution of equal and unequal cell divisions in QD labeled cell populations. The relative amount of cell divisions with equally and unequally transferred QDs was quantified by analyzing time lapse picture series of four experiments. In total, 242 cell divisions were prorated to the equal and unequal way of QD transmission.
