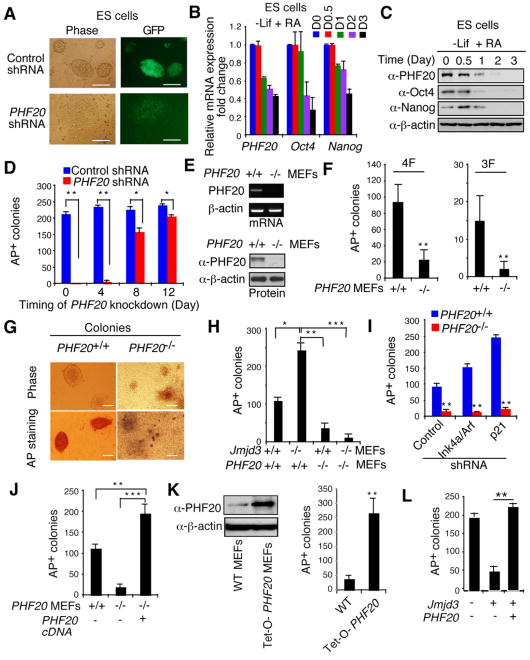
Figure 4. PHF20 Is Essential for Maintenance and Reprogramming of iPSCs.
(A) Bright-field and GFP images of ESCs transduced with PHF20-specific or control shRNA. Scale bars, 50 μm. (B) Real-time PCR analysis of PHF20, Oct4 and Nanog expression in ESCs treated with 1 mM RA and LIF withdrawal. (C) Western blot analysis of PHF20, Oct4 and Nanog expression after treatment of ESCs with 1 μM RA and LIF withdrawal. (D) Colony formation after PHF20 knockdown by PHF20-specific or a control lentivirus-based constitutive shRNA at different time points (i.e., day 0, 4, 8 or 12) during reprogramming of Tet-O-4F MEFs. AP-positive colonies were counted on day 14. (E) PCR and Western blot analyses of PHF20 expression in WT and PHF20-deficient MEFs. (F) AP-positive colony numbers were counted on day 14 of 3F- or 4F-mediated reprogramming of WT and PHF20-deficient MEFs. (G) Bright-field images and AP staining of iPSC-like colonies from WT and PHF20-deficient MEFs. Scale bars, 50 μm. (H) Number of AP-positive colonies counted on day 14 of 4F-mediated reprogramming of WT and PHF20 single, or Jmjd3 and PHF20-double KO MEFs. (I) Number of AP-positive colonies on day 14 of 4F-mediated reprogramming of WT and PHF20 KO MEFs transduced with Ink4a/Arf- or p21-specific or control shRNA. (J) Number of AP-positive colonies counted on day 14 of 4F-mediated reprogramming of WT and PHF20 knockout MEFs with or without PHF20 cDNA expression. (K) Western analysis of PHF20 expression in WT and Tet-O-PHF20 transgenic MEFs expressing rtTA in the presence of Dox. AP-positive colonies were counted on day 14 of 4F-mediated reprogramming of rtTA-expressing Tet-O-PHF20 transgenic MEFs. (L) Number of AP-positive colonies counted on day 14 of 4F-mediated reprogramming of WT MEFs transduced with Tet-O-Jmjd3 or Tet-O-PHF20 in the presence of Dox until day 10. The data in panels D, F and H-L are plotted as means ± SD with indicated significance (*p < 0.05, **p < 0.01). See also Figure S4.

