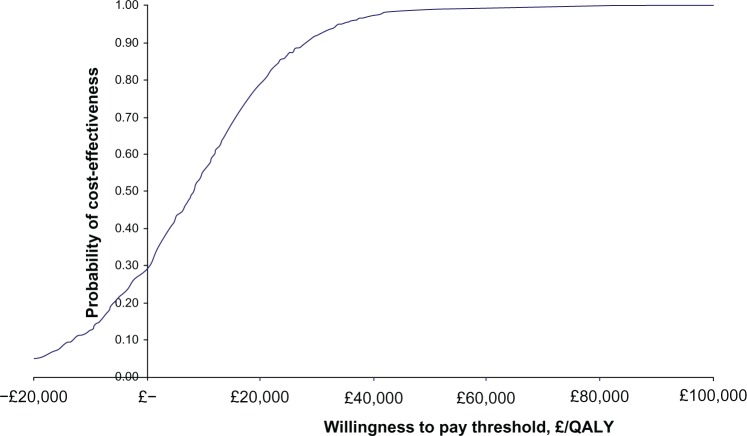
Figure 2.
Cost-effectiveness acceptability curve depicting the expected marginal cost/QALY gained with aprepitant versus the UK clinical practice comparator regimen.
Note: The Y-axis shows the probability of the aprepitant regimen being cost-effective as a function of increasing levels of willingness to pay (shown on X-axis).
Abbreviations: £, pound sterling; QALY, quality-adjusted life year.

