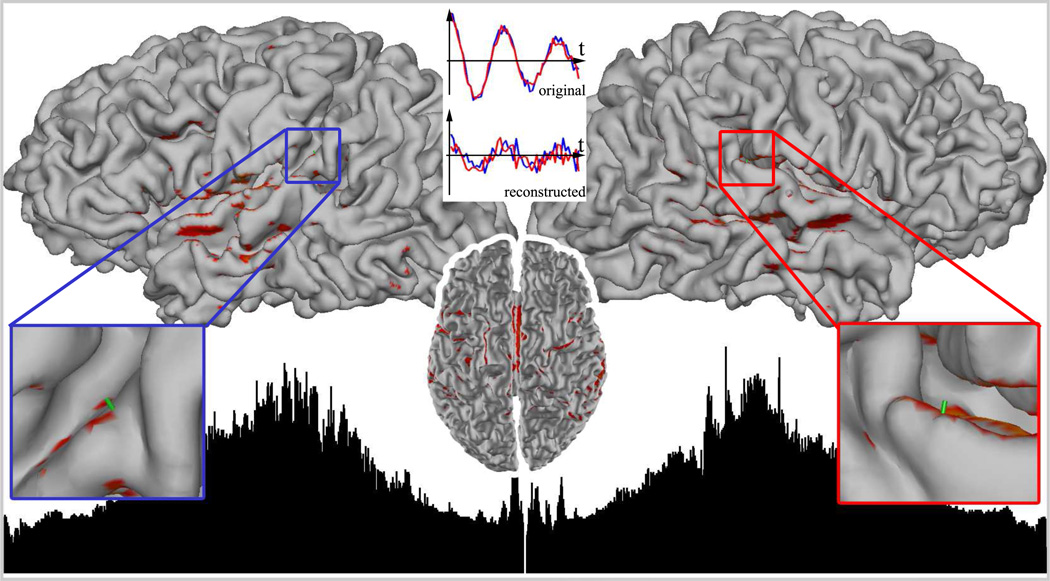
Figure 3.
Beamforming activity index calculated from the EEG forward solution is shown in black (arbitrary units) below the subjects’ brain surfaces (arranged left to right: left hemisphere anterior to posterior, right hemisphere posterior to anterior) and is also plotted color-coded on the cortical surface with the threshold of 3 standard deviations. Two highly correlated sources are located in the primary auditory cortices. The results indicate that the neural activity is detected as originating from an area around and between the auditory cortices. The top middle insert shows the simulated and reconstructed time series of the 2 correlated sources.

