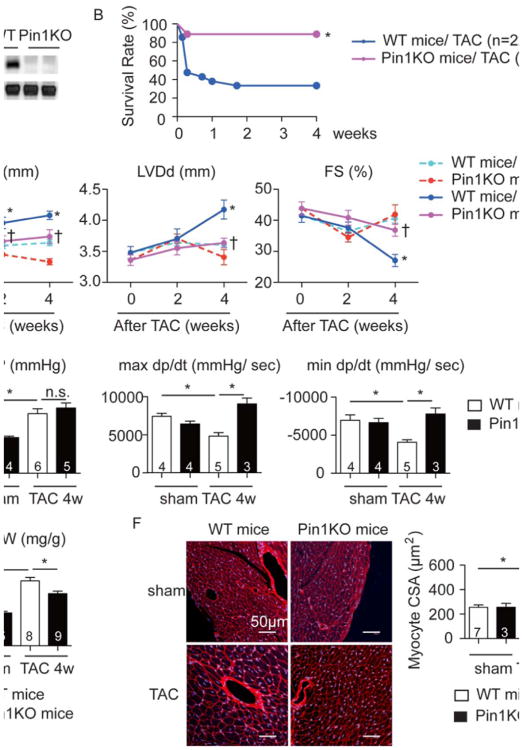
Figure 2. Loss of Pin1 attenuates hypertrophy and preserves cardiac function upon pressure overload.
A, Immunoblot showing Pin1 expression in the heart of wild type (WT) and Pin1 knockout (Pin1 KO) mice. B, Kaplan-Meier curve after TAC procesure. * p<0.05 versus WT mice exposed with TAC. C, Echocardiographic analysis at the indicated time points after TAC procedure showing posterior wall thickness at diastole (Pwd), left ventricular dimension at diastole (LVDd), and fractional shortening (FS). * p<0.05 vs WT sham, † P<0.05 versus WT TAC at the same time point. D, Invasive hemodynamic assessment 4 weeks after TAC showing arterial systolic blood pressure (BP), maximal (max dp/dt) and minimal (min dp/dt) changes of developed pressure over time. * p<0.05. E, Heart weight to body weight ratio (HW/ BW) at 4 weeks after TAC. *p<0.05. F, Sections 4 weeks after TAC stained with Wheat Germ Agglutinin (WGA, red) and To-pro3 (blue) (left), quantification of cross sectional area of cardiomyocytes (CSA, right). *p<0.05.

